VIPs
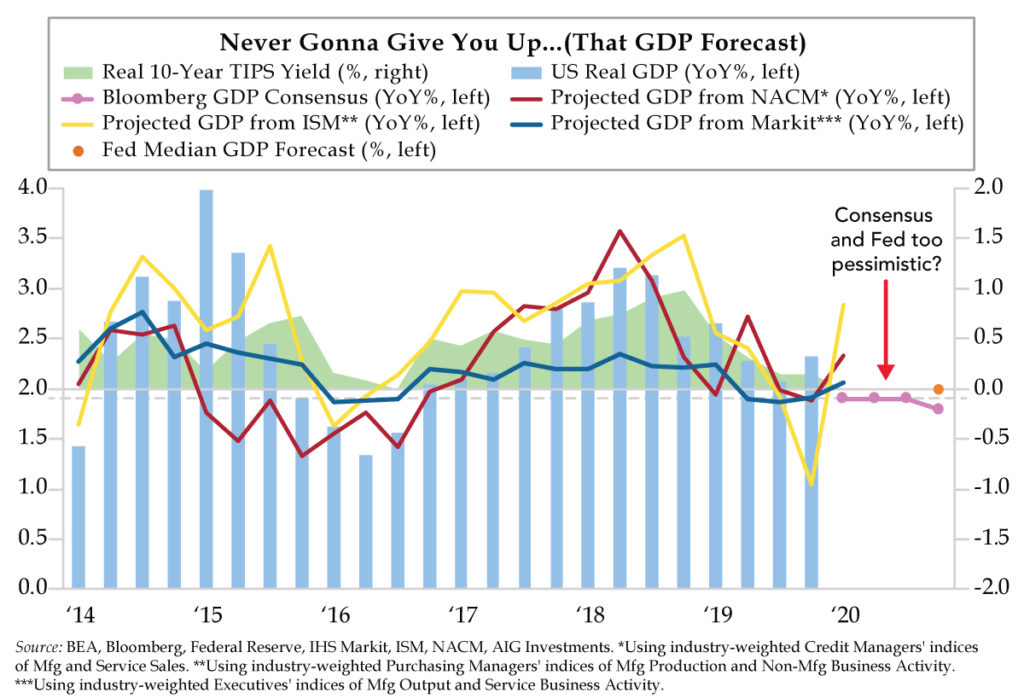
- Utilizing key data from monthly data supplied by NACM, Markit and ISM, QI created composites to explain the year-over-year trends in real GDP; these indicators are especially effective when the consensus is too bullish or bearish
- All three GDP forecasts from NACM, Markit and ISM are marginally higher than consensus and Fed estimates based on January data; there are greater opportunities to position for upside surprises based upon beaten down numbers driven by the coronavirus
- Since last week’s peak coronavirus fever, market rate-cut expectations have improved from two in 2020 to one-plus come December; the v-shaped move in expectations is a product of hopes for a speedy resolution to the coronavirus rather than improved U.S. growth prospects
Most of the time you hear a song, you’re inclined to envision the singer in your mind, which is easier said than done if you know the artist. But what if it’s someone new who bursts onto the scene? For those of you of the true MTV generation, we’re talking about Rick Astley and his worldwide number one smash hit, “Never Gonna Give You Up.” Back in 1987, it was hard to square that soulful voice with the 5’9” frame of this British singer/songwriter. Stereotypes be damned, belt it out Astley did.
The title of Astley’s song reminds us of how economists approach their published projections. Before we continue, we assure you this isn’t a dig at the forecasting community. We understand it’s their job to take a stand and make a call down to the decimal point. But we know most forecasts eventually turn out to be wrong. Maybe it has to do with holding on too long to a view, like you’re never gonna give it up.
Prescient prognosticators are nimble with their forward guidance. They’ve been humbled by the vagaries of the data in the past and aren’t wedded to their views. As such, they constantly test their forecasts’ accuracy and validity? Or perhaps they’re more willing to adjust their outlooks when new and compelling information presents itself. We like to think that we fit this mold.
Such intellectual flexibility brings us to the chart of the day. Each month, there are fundamental reads on the pulse of the U.S. economy. The first up is the National Association of Credit Management’s (NACM) Credit Managers’ Index. The second comes from the two IHS Markit reports on manufacturing and services that poll C-suite executives. And the third arrives care of the Institute for Supply Management (ISM), compiled via procurement professionals queried in its manufacturing and non-manufacturing surveys.
From each report, we repackage key indicators that mirror top-line activity into projections for GDP. From NACM, we tap sales indices for manufacturing and services. Markit gives us manufacturing output and service business activity. And ISM proffers manufacturing production and non-manufacturing business activity. After applying appropriate industry weights to form a composite indicator, these metrics then stand as the inputs in simple regression models to explain the year-over-year trend in real GDP.
We’re wise to none of these models being perfect. What models is? But we find value in them as guides for triangulating the ups and downs of the economy’s growth path. They have particular utility when the consensus of economists and the Fed are either too bullish or bearish relative to the near real-time guidance communicated by our trifecta.
For the January channel checks, all three GDP projections – NACM (2.3%), Markit (2.1%) and ISM (2.8%) are running hotter than the consensus (1.9%) and the Fed’s expectations (2.0%). We’d be disappointed if you didn’t push back given these measurements were taken prior to the escalation of coronavirus. The health scare dials up the downside risk for near-term growth prospects. You have a point. And we’re mindful that these soft-data readings could surprise to the downside next month.
For the moment, that sounds like a crowded asymmetry. The surprise factor for the U.S. growth outlook will not be if NACM, Markit and ISM all report cleaner post-coronavirus data and disappoint market expectations. The surprise will manifest in their beating the beaten down consensus instead. If you’re a betting soul, there’s more opportunity to position for upside surprises vs. the alternative come February releases.
What’s depicted in the background of today’s chart? That would be the U.S. real 10-year yield on inflation indexed securities (TIPS). Real rates are an expression of real activity and expectations for future central bank actions. With the Fed desperate to pause and higher stated hurdles for moves in either direction, indicators that inform about the growth outlook could have more explanatory power for movements in TIPS yields for the time being.
After trading as low as -0.14 last Friday concurrent with peak coronavirus fear, the real 10-year yield closed at 0.00% yesterday. Viewed through a different prism, rate cut odds have cooled from two in 2020 to one-plus come December. We don’t believe that this v-shaped slingshot move (not illustrated above) has anything to do with stronger U.S. growth prospects. It’s more about hopes for a speedy resolution to the health situation in China.
“How are you pricing coronavirus risk?” will be the key question for sell-side economists in coming days and weeks. But this is no easy task with anything but forthright data on the true scope of the outbreak. With that as a given, expect the consensus to not give up on its forecast. In the interim, watch real rates which will act as the pivot for the nominal 10-year Treasury.