According to the Encyclopedia of Chicago, “With nearly 40,000 residents of Austrian ancestry at the end of the twentieth century, Chicago is, at least symbolically, the most Austrian city outside of Austria itself.” It all began in 1890. Chicago became the key destination of Burgenlanders (from Burgenland in eastern Austria) immigrating to North America. Economic necessity was the motivation; many did not own land and relegated to weekly labor stints in Vienna. The mass migration took place during three periods: (1) from about 1890 to 1914; (2) from the collapse of the Austro-Hungarian Empire at the end of World War I (1918) until the rise of National Socialism in the 1930s; (3) post–World War II. Immigration between the world wars was not only the most extensive; it also played the most critical role in shaping Burgenland-Chicago identities. During this period most Burgenlanders worked in the stockyards, for railroads, or in related industries, such as foundries and construction. Not surprisingly, “Little Burgenland” took shape along a stretch of railroad lines paralleling today’s corridor of the Stevenson Expressway.
The Austrian connection to Chicago assumes a different contour in the dismal science. As background, Austria is known for its specialization as a high-value supplier of components, technologies and engineering services to the global automotive industry. It’s a key supplier hub; it’s hard to find a car anywhere in the world that does not contain components “Made in Austria,” home to Magna Steyr, the world’s largest contract manufacturer which churns out the Mercedes G-Class and the BMW 530e Plug-In Hybrid. Naturally, Austria also has close ties to Germany, Europe’s auto hub. Take BMW’s engine plant in Steyr, for instance – it produces the “heart” of more than half of all new BMW Group cars worldwide.
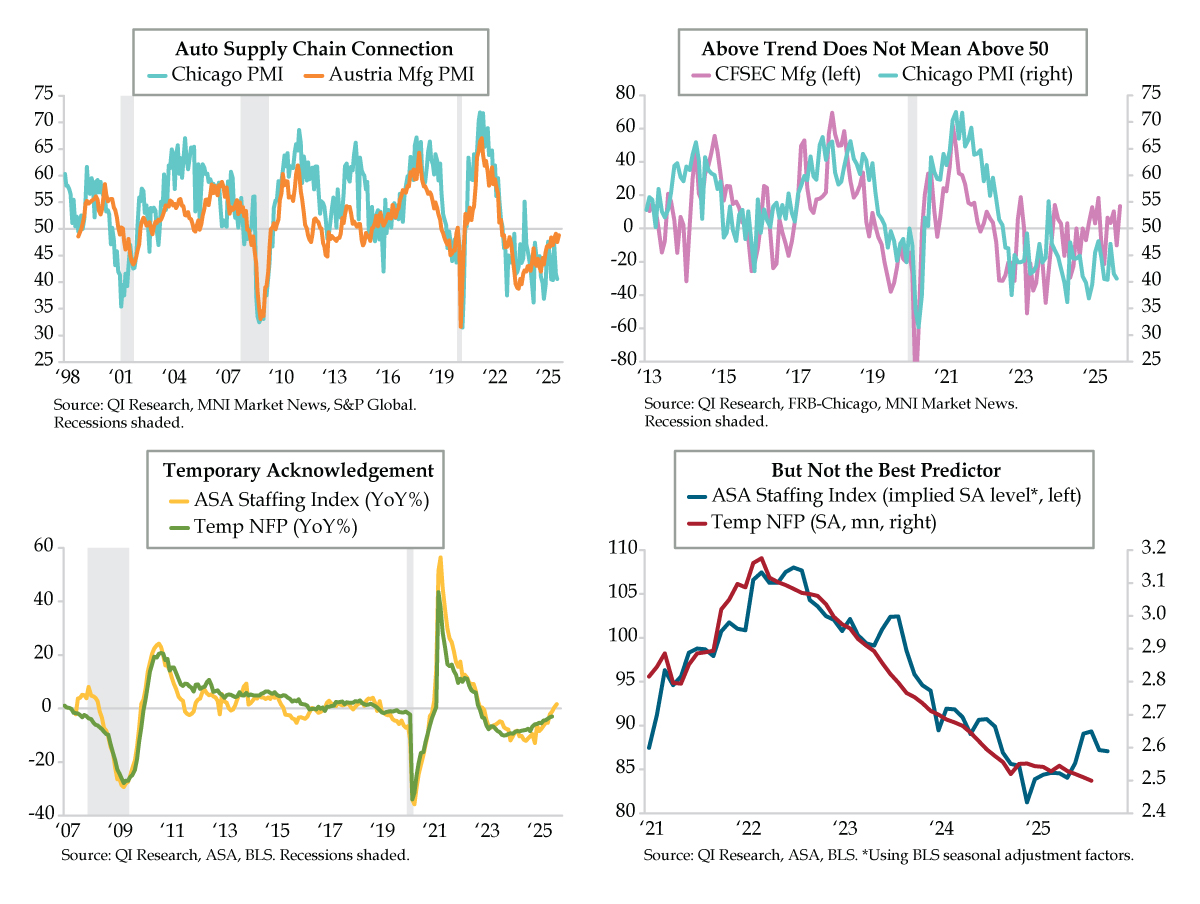
It follows that Austria’s manufacturing purchasing managers’ index (PMI) should move in spirit to the Chicago PMI that’s taken the pulse of America’s auto industry for decades. Wednesday saw Austria’s headline number rise to 48.8 in October, from 47.6 in September (orange line). Since its 1998 inception, it’s closely tracked the higher volatility Chicago gauge. The correlation over the timeframe depicted was a hearty .76; since 2021, though, it became a decidedly tighter .89. In the last year, the Chicago PMI (aqua line) ran that of Austria’s for 11 of the 12 months ended September as if the latter was a resistance line for the former. Today’s Chicago PMI consensus estimate of 42.0 would continue the trend.
Closer to home, the Chicago Fed Survey of Economic Conditions (CFSEC) tries its own hand at gauging the only report on Friday’s U.S. economic calendar. It’s captured key inflection points in the overlapping history since 2013, despite having a .63 correlation from that point forward. More recently, the above-trend (above zero) readings have not corresponded to an expansionary Windy City PMI. If nothing else, when the CFSEC manufacturing metric jumped to a two-year high of 18.4 in March (lilac line), it coincided with the Chicago PMI’s 47.6 (aqua line), also the “best” reading since November 2023. September’s fall back to 40.6 could give way to an uptick this month. Using CFSEC as a guide, the 23.6-delta from last month’s -10.0 to this month’s 13.6 level argues for an “improvement.” Historically, when the CFSEC figure posted a monthly change of more than 20 points, the average concurrent gain in the Chicago PMI was 1.3 points.
Shifting gears to the Federal Reserve’s employment mandate, an interesting situation has bubbled up in the temporary employment space. The American Staffing Association (ASA) indicated on Tuesday: “The staffing industry continues to make steady progress in what is otherwise a sluggish year for the labor market, with the ASA Staffing Index marking its sixth week of positive year-over-year growth. Despite economic headwinds, the recent gains forged by staffing companies raise a higher platform to build from in 2026.” Does it seem an odd moment to have a green shot with layoffs tracking to a two-year high?
Taken at face value, ASA’s smoothed, monthly signal turned positive on a year-over-year (YoY) basis in September and October, at respective rates of 0.3% and 1.7% (yellow line). These back-to-back increases ended the longest uninterrupted stretch of YoY declines in the 32 months from January 2023 to August 2025. Because the ASA tracks its nonfarm payroll (NFP) peer for temps, it follows that there’s upside risk to the BLS’s official figure. At last report, it registered a -2.9% YoY contraction in the 12 months ended August (green line).
Any downturn in a cyclical leading indicator that’s lasted almost three years is bound to at least stabilize. But let’s not get ahead of ourselves. Seasonally adjusting (SA) the ASA monthly figures demonstrates it’s not been the best predictor of SA temp NFP. We do hat tip ASA for coming close to temp NFP’s March 2022 post-pandemic peak of 3.176 million (red line). The downcycle since has been much steadier for the official series than for the implied SA ASA index (blue line). Tongue twister aside, ASA’s ramp from May to August contrasted with monthly declines in temp NFP of -15,000, -10,000, -10,000 and -10,000.
It will take time to sort out if, and when, the temp employment cycle finally bottoms. In the meantime, don’t be surprised if it spawns a bullish macro narrative in markets, one that takes the ASA ball and runs with it. It’s interesting timing for this to surface given Fed Chair Powell’s Wednesday FOMC messaging that knocked December’s probability for a rate cut from 92% to 73% as of yesterday’s close. ASA could bolster the ‘not a foregone conclusion’ argument.