Philadelphia sports fans are notoriously stereotyped. Like any fanbase, there are always some who will take things too far. Jon McCann used to fit that description by mocking athletes, including his infamous spat with Sixers player Ben Simmons. In 2023, newly signed $300 million Phillies shortstop Trea Turner was going through a massive batting slump, well below his career average, and the tough Philly faithful were raining boos on him. McCann seized the opportunity to change his ways as a hyper-aggressive superfan through his social media platform known as “The Philly Captain.” Netflix’s 2024 documentary The Turnaround takes viewers through his journey. McCann, who was open about his own struggles with mental health, encouraged fans to give Turner a standing ovation instead of the boos to show him that his new city had his back. On August 4, 2023, the stadium heard McCann’s message and executed his plan through a series of standing ovations. Turner’s performance skyrocketed, and he went on a historic hitting tear that helped propel the Phillies into the postseason.
This was a textbook example of how good old-fashioned support can do wonders for any slumping athlete’s performance. It speaks volumes to the power of positive energy and good vibes. Taking a page out of McCann’s playbook, why don’t we all stand up and cheer for the U.S. housing market to end its slump? Too bad it isn’t that easy.
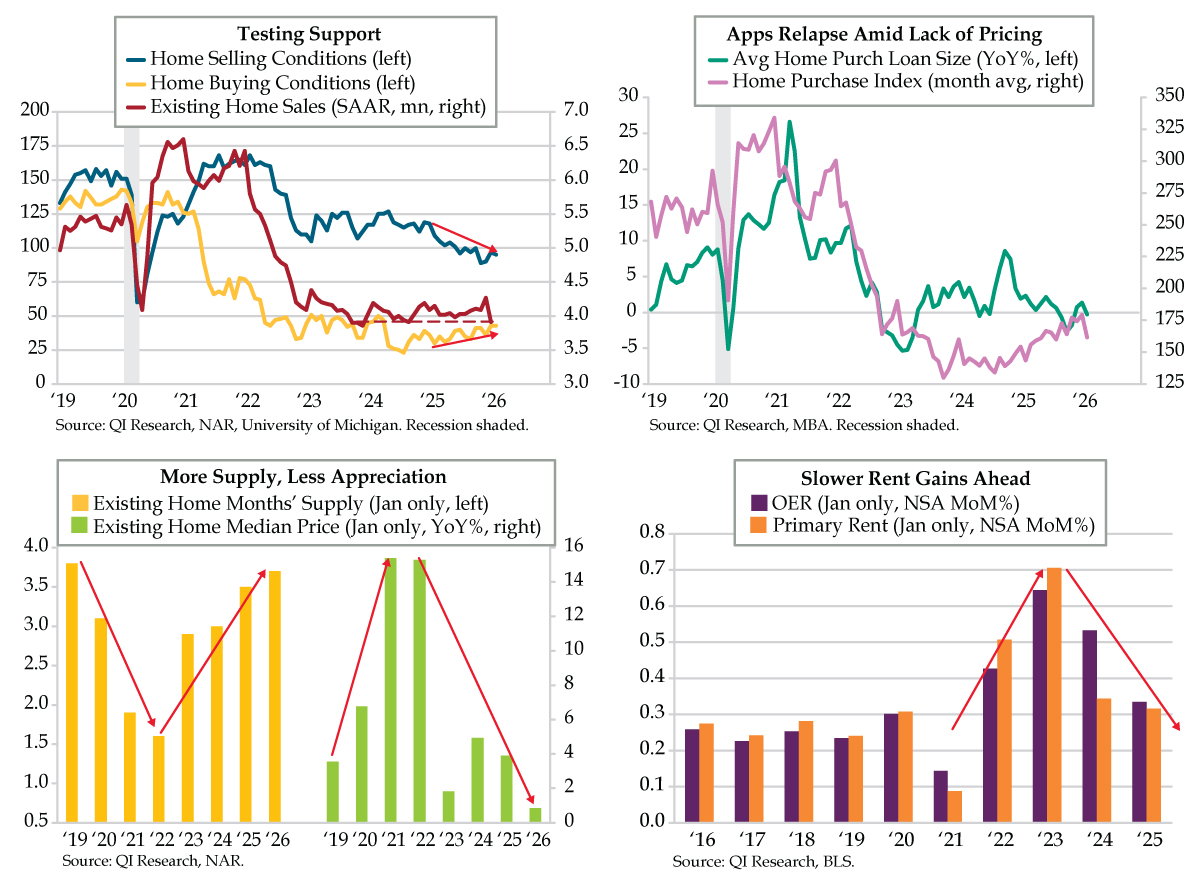
Thursday’s Existing Home Sales disappointed all but one of 55 economists Bloomberg surveyed. Since the 1999 inception, the 8.4% month-over-month plunge was the eighth largest sequential decline on record, a 2nd percentile outcome. It pushed home resales down to a 3.91 million seasonally adjusted annual rate (SAAR), reversing all the gains of the previous 15 months. At 3.91 million, this can be considered a floor going back to the December 2023 cycle low of 3.86 million (red line).
The National Association of Realtors (NAR) Chief Economist Dr. Lawrence Yun weighed in: “The decrease in sales is disappointing. The below-normal temperatures and above-normal precipitation this January make it harder than usual to assess the underlying driver of the decrease and determine if this month’s numbers are an aberration.” The weather as an excuse is quaint. However, if the NAR’s Realtors Confidence Index’s median time on the market falls back in February, it would explain the weather away. If you’re keeping score, this gauge rose to 46 days in January, up from 39 days in December and 41 days in January 2025.
To harp on this red herring, existing home sales are closings that reflect activity from one to two months prior. Moreover, November and December were unseasonably warm. Nevertheless, the gradual up creep in home buying conditions (yellow line) at the margin underpins the level of demand. However, the downtrend in home selling conditions (blue line), which has yet to durably turn higher, is likely keeping a lid on the sales path.
From the high-frequency department, the Mortgage Bankers’ Association’s (MBA) weekly report also flagged a setback. The MBA purchase index fell to 161.50 in the first week of February (lilac line), a noticeable turn down from January’s 179.34 average, itself a three-year high. The grind lower in 30-year mortgage rates, close to the 6.00% level thus far in February, has lost traction. Alongside apps relapsing, the average home purchase loan size, which proxies price trends, eased to $445,000 in the week ended February 6. Compared to a year ago, the provisional February trend is down 0.3% (teal line). If sustained for the month, it would mark the fourth year-over-year (YoY) decline in the last six months.
NAR’s inventory data adds depth to the home price discussion. Unadjusted existing home months’ supply rose to 3.7 in January, the highest since 2019 (yellow bars). This is nothing new. A look back over 2025’s second half assists: From July to December, the raw months’ supply levels were the highest since 2016, 2017, 2018 and 2019, respectively. January’s widening supply has been in train since 2022’s 1.6 figure. The laws of supply and demand have not been repealed; rising months’ supply will manifest as lower home price appreciation. January’s 0.9% YoY gain bears that out (green bars), a marked deceleration from the 15%-plus YoY increase of four years ago.
Directionally, these home price developments are an indirect expression of shelter inflation in today’s U.S. consumer price index (CPI) report. Owners’ equivalent rent (OER) and primary rent have drawn a similar mountain to the January performance for existing home median prices. The key difference is that the elevated gains for the latter topped out a year (in 2022) before the rent measures (in 2023, OER at 0.71% MoM and primary rent at 0.65%, purple and orange bars). Subsequent January deceleration was more obvious for OER – 2024 at 0.53%, 2025 at 0.34% – than for primary rent – 2024 at 0.34%, 2025 at 0.32%.
The loosening that continues in the broader resales market suggests today’s CPI rent measures could come in below the 2025 NSA changes. Look for lower seasonally adjusted gains for OER and primary rent relative to December’s respective 0.31% and 0.26% run rates. Should this occur, it would counter the 0.3% MoM January consensus estimate that’s a tenth higher than December’s 0.2% figure.
Were this fundamental downside risk realized from the heavyweights of the core CPI, it would add to the rally in the U.S. 10-year Treasury that closed Thursday’s session at 4.10%, a two-month low. From a technical perspective, the global risk-free rate broke below the 100-day moving average of 4.13%. With the 50-day average (4.18%) and 200-day average (4.22%) above that threshold, a downside surprise in the core would add to the momentum of the Treasury rally and the ongoing fall in mortgage rates. It may not be a standing ovation for the housing market, but it would help the slump at the margin from a financing conditions standpoint.