Chyrons are everywhere. So ubiquitous are they in everyday life, that they are easily overlooked even though they pop up all the time. A Chyron (pronounced KY-ron) is the text, graphics or banners that appear at the bottom of a television screen during a broadcast. When watching the news or a live sporting event, you see them constantly. They’re used to display the name and title of the person speaking, summarize the current news story, or provide live sports scores or key statistics. Chyron is actually a generic trademark, similar to Kleenex or Band-Aid; it comes from Chyron Corporation, the American broadcast technology company best known for pioneering real-time on-screen graphics, “lower thirds” and text overlays for live television. Should – operative word – the New York Knicks sweep Danielle’s hometown San Antonio Spurs by the time you read this, the associated Chyron would read: “Teams ahead 3-0 in the NBA Finals have never lost the series.” History shows a perfect 100% hit rate for the 14 times that the Finals have gone that way.
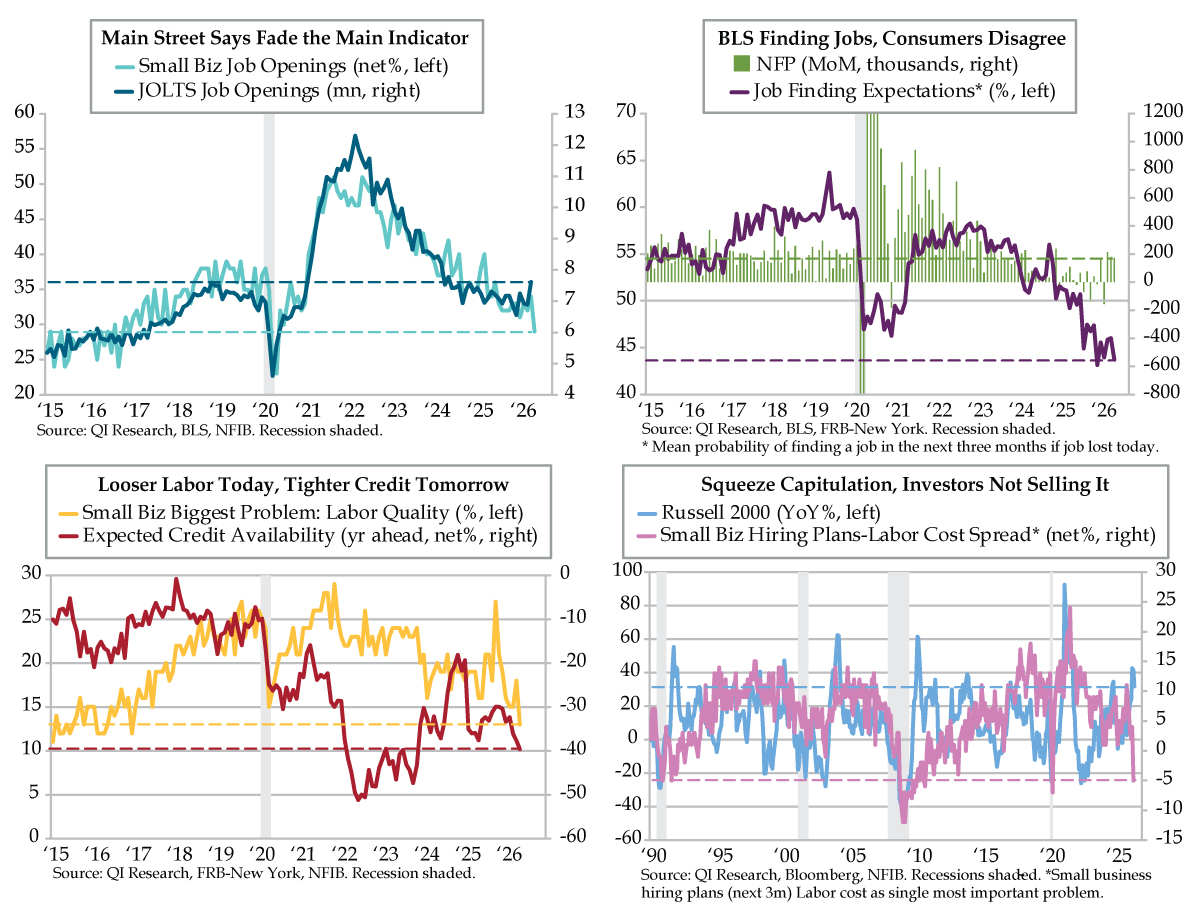
The National Federation of Independent Business’s (NFIB) May Jobs Report revealed a similar nugget. Last Friday, Small Business Job Openings fell 5 points to a net 29% (aqua line), while Small Business Hiring Plans declined 4 points to a net 13%. The combined 9-point compression stands as an outlier since the 1986 inception of both NFIB monthly series. The reason we single these out is that they are components of the aggregate NFIB Small Business Optimism Index. The 9-point drop tied for seventh worst of all time. In the prior six occurrences, the NFIB headline index registered a month-over-month (MoM) decline every time for a perfect 100% hit rate. On average, the MoM decrease was 2.6% and ranged from -3.4% to -2.1%. If past average performance proves accurate, May’s Small Business Optimism Index should come in at 93.4, below the 96.0 consensus estimate and April’s 95.9 figure.
One of the values of the NFIB’s labor data is that they allow for channel checks against the conventional measures. Job openings are Exhibit A. Last week, market participants celebrated the Bureau of Labor Statistics’ (BLS) JOLTS job openings, which shattered market expectations with an April figure of 7.618 million, 11% north of the consensus estimate (dark blue line). Per Bloomberg, outside the pandemic, it was the largest beat on record. Main Street’s May guidance suggests the “good” news was flat wrong and will be revised lower; like nonfarm payrolls (NFP), JOLTS is tainted by the broken birth/death adjustment. NFIB’s Job Openings were the lowest since the pandemic month of May 2020 and the non-pandemic month of December 2016 (dashed aqua line).
But the BLS keeps finding jobs – at least, that’s what the narrative holds. Last Friday’s 172,000 MoM gain (green bars) was the third straight triple-digit advance, a streak last seen in early 2024. Market participants can’t help but take this as gospel; they’ve more than fully priced a quarter-point Fed hike by December.
Among the many conflicting labor market indicators is Monday’s release from the New York Federal Reserve via its monthly Survey of Consumer Expectations (SCE). We pose the question: “If jobs are so plentiful, then why do consumers think that they will have a difficult time finding them?” The SCE’s Job Finding Expectations metric fell to 43.7% in May, the second lowest on record behind December 2025’s 43.1%. Flip the May figure on its head, and it tells you that consumers’ probability of not finding a job in the next three months if jobs were lost today was 56.3%. Moreover, Job Not-Finding Expectations have been above 50% every month since August 2025. We emphasize that NFP over that 10-month span is not set in stone yet and is subject to a benchmark revision.
The hits kept coming from NFIB: “In May, 13% of small business owners identified labor quality as their single most important problem, down 5 points from April [yellow line] and marking the lowest level since December 2016.” Oscillations in labor quality proxy are decisive: Higher numbers suggest fewer candidates and vice versa. May’s 10-year low paralleled expectations for tighter credit availability. As noted in the SCE, the percentage of respondents anticipating it would be “somewhat” and “much” harder to obtain credit one year from now from those who said “somewhat” and “much” easier generated a -39.6-point spread (red line). Tighter credit expectations and a looser labor situation tend to go hand in hand, especially from lenders’ perspective. Borrowers (i.e., consumers) are already wise to this.
The NFIB report also flashed capitulation: “Labor costs increased significantly to the highest reading in the survey’s history,” said QI mentor and NFIB Chief Economist Bill Dunkelberg. The 14% figure as the single most important problem also exceeded the net 9% of proprietors who planned to hire more workers. Labor cost anxiety is shifting the path of future staffing. The -5% inversion between the two series (lilac line) was a significant cyclical development, reaching a level consistent with past National Bureau of Economic Research recessions, observable over the timeframe illustrated in today’s fourth quad chart, especially during the 1990-91 and 2007-09 downturns. For now, investors are not “buying it,” i.e., they’re not selling the Russell 2000 small cap index; year-to-date gains exceed 30%. “Squeezed Labor Costs Crimp Future Employment” is how the Chyron would read and counters market bullishness.