If your young baseball or softball player is a student of the game, Ted Williams’ The Science of Hitting is required reading. In the so-called hitter’s bible, Williams, the last man to hit .400 for a major league season, explains his three rules. The first: To get a good ball to hit…you must know where in the strike zone you consistently hit the ball hard for high averages – those ‘happy areas’ – and know where you don’t, so you learn to lay off. The second rule, and something you always take to the plate: proper thinking. Have you done your homework? What’s this guy’s best pitch? What did he get you out on last time? The third thing is to be quick with the bat. It applies all the time. Sacrificing bat speed could be the difference between a dribbler to the pitcher and a double to the wall in left center. QI’s Dr. Gates can dispel any doubts. He hit .200 as a junior on his varsity baseball team. After some bible study of the hitting order, he raised his average to .500 in his senior year.
If you do take your eye off the ball, you can’t see it. Ergo, you can’t hit (or catch) it. This rudimentary lesson applies to understanding errors in judgment, which especially applies to the Federal Reserve. We don’t need to tell you that the reactionary Fed’s playbook has changed over the years. The addition of tools like large-scale asset purchases, forays into credit easing via mortgage-backed securities, the alphabet soup of lending facilities, and backstopping the corporate credit market have violated the Federal Reserve Act of 1913 many times over. The rub today:The Fed’s unconventional policy deployed in the aftermath of the shock of Covid delayed its response to inflation.
Believe it or not, fighting supply chain inflation was a regular thing in the pre-Quantitative Easing era. Back in the 1980s, money desk traders, the Fed watchers of yore, paid heed to the producer price index (PPI) for intermediate goods. They mattered for emerging inflation trends. That all changed in 2001 when China entered the World Trade Organization (WTO). Fast forward through the age of globalization and you appreciate that watching the supply chain for inflationary tea leaves ultimately required a microscope. The deflationary impulses of China and globalization lasted for two decades. What interrupted it was a hundred-year pandemic prompting the supply chain to rise from the ashes like a phoenix, reasserting its heft on the bond market. Global deflation turned to global inflation, and it wasn’t of the transitory ilk.
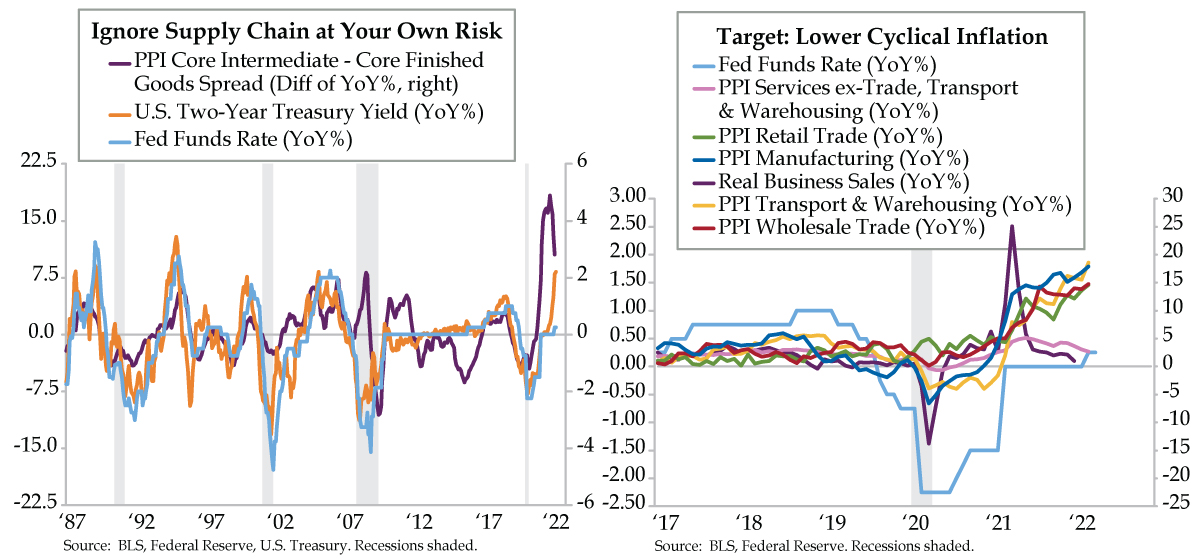
Today’s left chart portrays the cyclical nature of the supply chain through the spread of the inflation rates of the core intermediate PPI and core finished goods PPI (purple line). This de facto upstream to downstream impulse translated to higher inflation and rates when positive and lower inflation and rates when negative. From Greenspan’s tenure through QE, the Fed and the bond market followed it religiously. While the relationship went dormant for a spell, the U.S./China trade war woke it from its slumber.
To lean on a term we’re using with distressing regularity, central bankers’ “evolving” into the unconventional is so problematic, it has the potential to cause a policy error. Being squarely behind the curve is on full display in the year-over-year (YoY) trend in the two-year yield (orange line) as the Fed has pivoted aggressively. The Fed’s own rate actions – fed funds YoY (light blue line) – is poised to play catch up.
Over time, tighter monetary policy will act to slow demand in cyclical sectors and deflate pipeline cost inflation. Of course, supply-side impediments outside the Fed’s influence (e.g., Russia/Ukraine conflict) create additional pressures that should only amplify the common goal of fighting inflation.
To get down and dirty, the inflation in the Fed’s crosshairs is the most cyclically oriented. Industry-based data from the sub-basement of the PPI report illustrate the outsized pricing pressures in the production and distribution chain. In March, PPI inflation rates in the manufacturing, wholesale, retail and transportation & warehousing industries were 17.9%, 14.8%, 14.6% and 18.6%, respectively.
We would add that the catch-all PPI for the service sector (ex-trade, transport & warehousing) eased to a 13-month low of 2.7%, a signpost that screams STOP to the sell-side masses insisting services will grab the baton from goods spending. If the money is not there…
Back in the factory sector, stagflation risk for top-line growth in real business sales in manufacturing, wholesale and retail sectors is playing out in real time. This varsity coincident indicator, used by the arbiters of recession dating at the NBER, already downshifted to a 1.0% YoY pace in January. Historically, business sales volume would lead pricing up and down the contours of the business cycle. In the here and now, while global supply disruptions have let the inflation genie out of her bottle, lower sales volume has not been met with depressed inflation in manufacturing, wholesaling, and retailing.
Now the Fed belatedly has its eye on the inflation ball. Powell & Co. are chomping at the bit to accelerate tightening into the teeth of a pre-existing slowdown in cyclical parts of the U.S. economy that overlaps the manufacturing and service sectors. Anyone else notice the rally in the Treasury market after yesterday’s PPI report blew away the consensus? Traders were clearly quick with their bats.