“He/She will not do or commit anything tending to degrade him/her in society or bring him/her into public hatred, contempt, scorn or ridicule, or tending to shock, insult or offend the community or outrage public morals or decency, or tending to the prejudice of the Universal Film Manufacturing Company or the motion picture industry.”
During Hollywood’s Golden Age, “morality clauses” like this tightly controlled performers’ lives. When potential scandal arose, studios used “fixers” to disappear issues. Howard Strickling, MGM’s head of publicity from 1934 to 1969, was notorious, arranging lavender marriages for closeted actors and covert abortions for pregnant actresses. One of his wildest orchestrations was for actress Loretta Young, who had an affair with Clark Gable while on the set of The Call of the Wild. He arranged for her to give birth in secret and then had her daughter placed in an orphanage. Shortly thereafter, Strickling planted a story in the press that Young had “adopted” a child. No doubt, the relationship between big screen talent and “fixers” like Strickling was a complicated one. Even if his means were morally dubious, Strickling was often a star’s first phone call when they were in a bind.
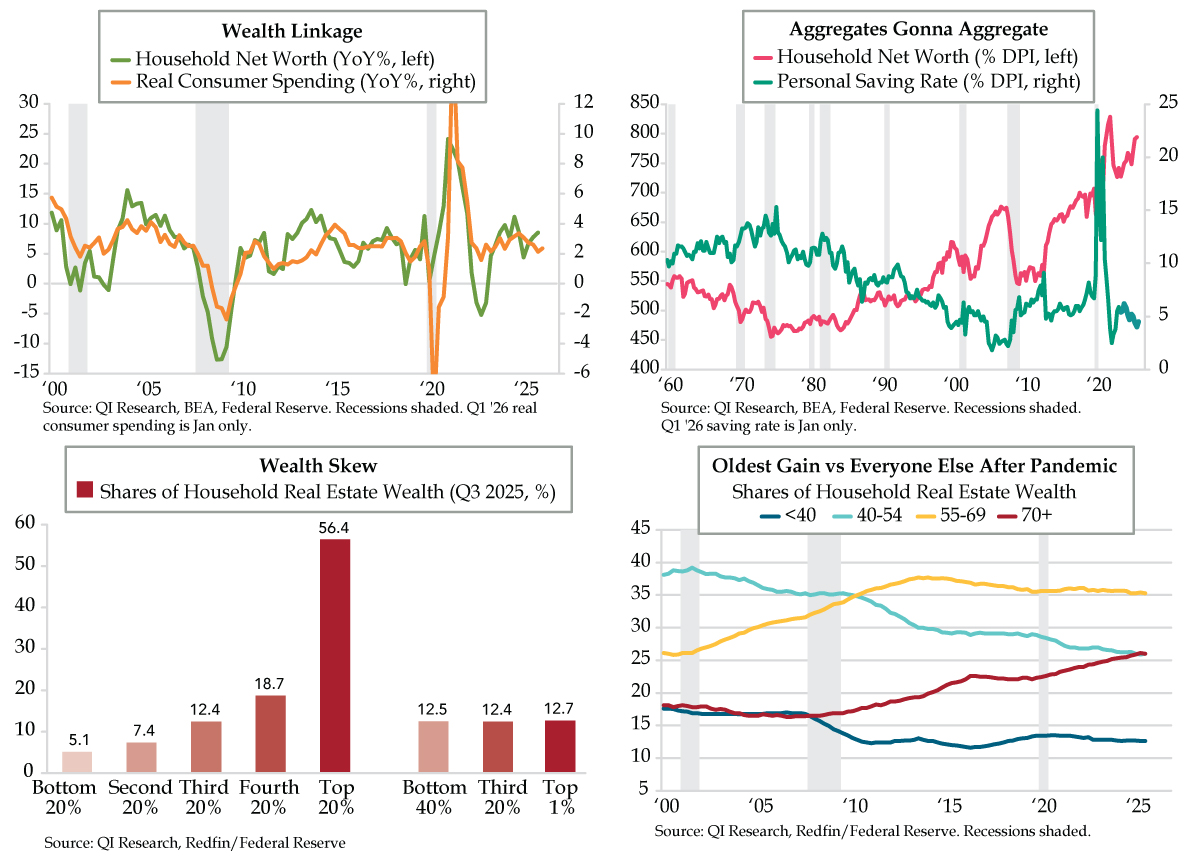
In the economic world, the relationship between wealth and consumption is far simpler: the more money you have, the more you’re willing to spend. Once every quarter, the Federal Reserve publishes its Z.1 release, summarizing the “Financial Accounts of the United States”. Included in this report is a measurement of aggregate household net worth, which ended 2025 totaling a record $184.1 trillion, a healthy 8.5% YoY advance (green line). Unsurprisingly, the biggest booster was “directly and indirectly held equities,” which accounted for $1.6 trillion (72%) of the $2.2 trillion increase over the quarter. These results suggested that, pre-Iran War breakout, real consumer spending was set to remain underpinned. January’s 2.4% YoY advance did just that, ticking up three-tenths from its 2.1% YoY average for 2025’s final quarter (orange line).
As a percentage of disposable personal income (DPI), household net worth now sits at 794.3%, the fourth-highest quarter on record and just shy of the 828.5% post-pandemic peak hit in 2022’s second quarter (fuchsia line). For reference, right before the onset of the Great Financial Crisis, this ratio peaked at 676.1% in the fourth quarter of 2006.
Somehow, the upward trend in aggregate net worth has occurred alongside the continued depletion in personal savings. The current saving rate has precedents only in the lead-ups to the 2001 and 2007-09 downturns. After hitting a local peak of 6.2% in 2024’s first quarter, it ended 2025 at 4.0%, and then popped to 4.5% to start 2026 (teal line). Tellingly, periods with significant run-ups in net worth and falling personal savings (mid-1980s, late 1990s, and the mid-2000s housing bubble) saw quick reversals at the onset of recession.
Looking at household net worth in the aggregate inherently miscommunicates — it masks the underlying distribution. In our “K-shaped” (or, better yet, “i-shaped”) economy, an increasingly smaller cohort of “haves” dominate at the expense of the masses. Besides equity ownership, much of household wealth today is in real estate. Redfin recently refreshed its estimates; as of the third quarter of 2025, the top 20% of income earners accounted for 56.7% of U.S. real estate wealth (red bars). Going further, the top 1% commands a 12.7% share that’s nearly identical to both the bottom 40% (12.5%) and the next 20% after that (12.4%). Interestingly, this distribution has remained fairly consistent over time. For comparison, in 2019’s final three months, right before the pandemic hit, the top 1% (12.9%) and top 20% (56.5%) were similarly skewed.
If there’s one variable for which the housing wealth distribution has changed markedly in the post-COVID era, it’s age. Households 70 and older are the sole cohort to see their share of housing wealth increase since the pandemic; they now hold more than a quarter, first crossing the 25% threshold in late 2023 (red line). Notably, 2025’s second quarter was the first time that their holdings surpassed the prime age 40-54 cohort, with both groups holding an identical 26% as of the third quarter (cyan line). Meanwhile, since 2000, the under-40 cohort has seen its share of household wealth fall from 17.6% to 12.6% (blue line). Iran-War-induced economic uncertainty has sent mortgage rates back up above 6.2%, which won’t do anything to bring younger, first-time homebuyers off the sidelines.
Growing housing unaffordability has led to people buying homes later in life: Redfin estimates the median age of a first-time buyer was 35 in 2025 while NAR figures it climbed to 40; in 2008, their estimates were a respective 31 and 30. This phenomenon drives second-order macroeconomic effects such as young adults living longer under their parents’ roof and taking longer to get married and have children. Per the Census Bureau, the median age of a first marriage is now 30, whereas it was 27 in 2010 and 22 in 1950. Data from the CDC shows that from 2016 to 2023, the average age of a first-time mother rose from 26.6 to 27.5, and the share of births for women over 30 had increased from 32.3% to 37.6%.
Today, we can tack on another war and longer-term fears of permanent, structural job loss for white-collar workers in a post-AI world to the mix. A recent Redfin survey found that 59% of Americans believe AI will eliminate jobs and make it harder for people to afford homes, while only 30% believed the opposite was true. In the Twitter-verse, we’ve seen big names come down on opposite sides of this debate. Former presidential candidate and tech entrepreneur Andrew Yang has sounded the alarm on what he believes is coming for white-collar work (he’s nicknamed it “The F***ening”), while Mark Cuban is more optimistic, equating the current adoption of AI to the early 1990s, when the personal computer became integrated into office environments and processes. As we’ve cited from Challenger, Gray, & Christmas, the lion’s share of layoffs year-to-date has been driven by negative cyclical factors, notAI. That won’t keep millions of younger Americans from wishing there was a “fixer” they could call to quell their anxieties.