According to Johns Hopkins Medicine, the body’s main vital signs routinely monitored include body temperature, heart rate, respiratory rate, and blood pressure. An easy fifth is oxygen saturation. The most precise way to measure the amount of oxygen circulating in your blood is invasive via an arterial blood gas analysis. A given trip to the emergency room, however, lands a finger in a loose vise, a quick triage to gauge peripheral oxygen saturation (Sp02) with a pulse oximeter, which can also be purchased for home use. These nifty gadgets, which can be had for about $15, are also useful for parents who stress over their kids’ oxygen levels when they come down with something that sounds like it’s a notch or two worse than the common cold. Given the most recent winter replete with RSV, or Respiratory Syncytial Virus Infection, which presents in children younger than 1 year of age in the United States as pneumonia, we’d have to say the small investment pays for itself by way of a peace of mind dividend.
Measuring an economy’s vital signs is an even more complex process. The composition of gross domestic product (GDP) canbe used as a benchmark for developed economies with substantial domestic demand footprints, such as the U.S.’s 68% share. As much as consumption dominates, it’s arguably shortsighted to ignore business investment. In the pre-pandemic half-century, the year-over-year (YoY) trend in gross private domestic investment (fixed investment plus inventories) had a higher correlation (.80) to YoY changes in the unemployment rate vis-à-vis consumer spending (.58). Simply put, capex drives the economic expansion which, in turn, drives the job market.
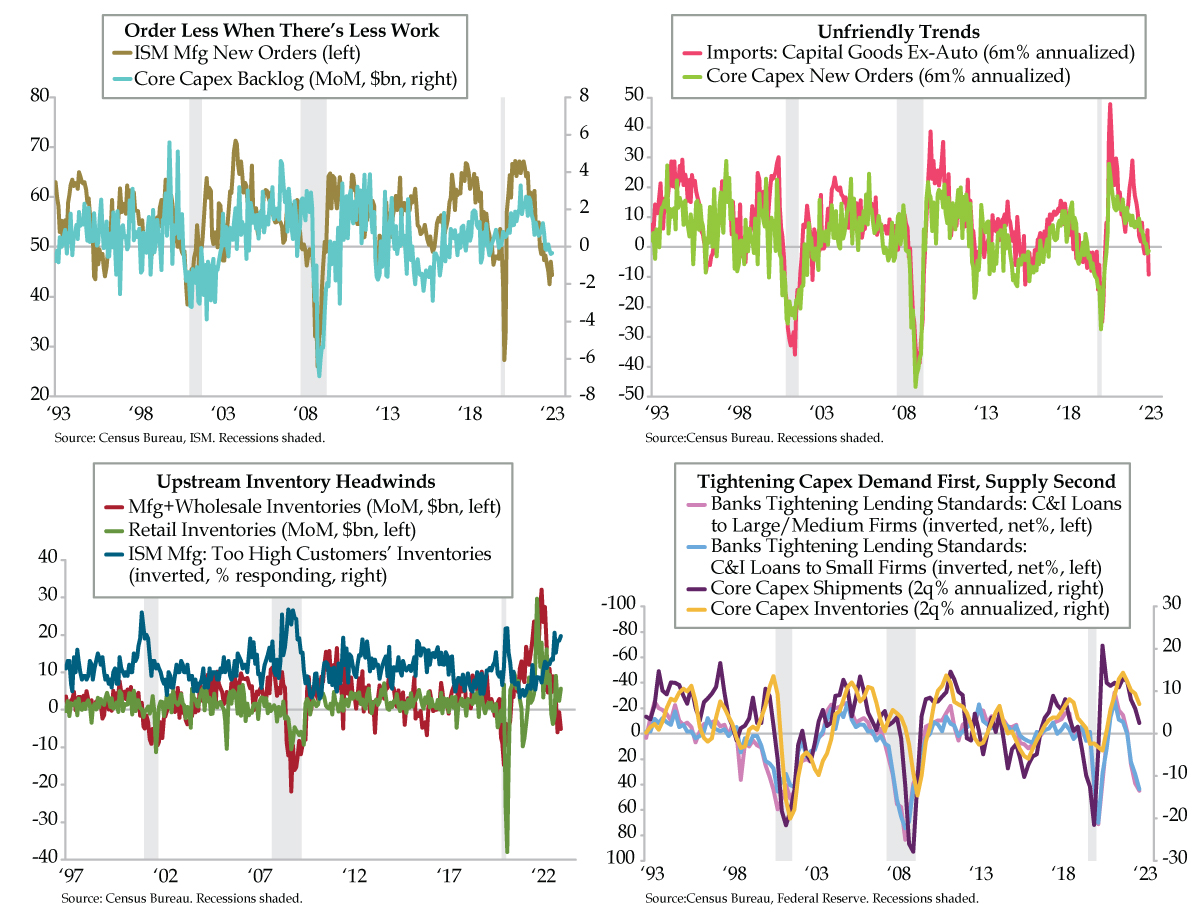
On Wednesday, we referenced backlogs of the soft-data survey variety. Today, we use this future demand indicator in its hardest form — changes in the backlog for nondefense capital goods ex-aircraft, the difference between the level of core capex new orders and its shipments counterpart (teal line). The former leads the latter (which is a direct input into business investment in GDP) and has been negative in five of the last six months. Past persistence in this metric has run in tandem with U.S. recessions in 2001 and 2007-09 as well as the 2012 Euro Area recession and the global 2015-16 industrial recession. Less future work explains why this gauge also guides the ‘it-girl’ of leading indicators, ISM manufacturing new orders (olive line).
Yesterday’s Advance Goods trade data opened a lens on global capex. Imports are flashing red. The six-month annualized rate fell to -9.1% in March from 5.6% in February (fuchsia line). The -15-point swing equilibrated to a z-score of about -2 and signals downside risk to already negative core capex orders (lime green line).
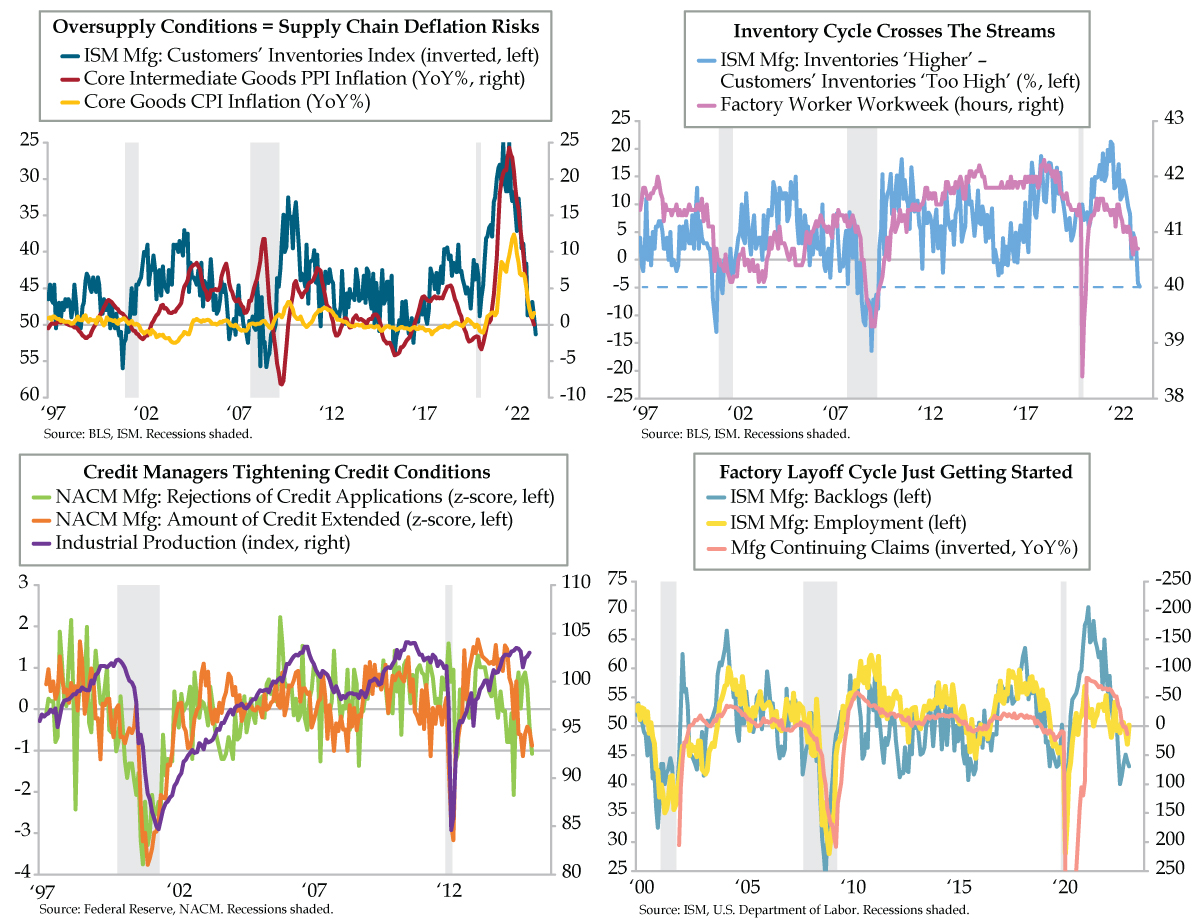
Wednesday’s data docket also refreshed the inventory backdrop. To set the scene, March’s ISM manufacturing survey depicted a relapse to oversupply in the upstream supply chain. ‘Too high’ customers’ inventories nearly pierced the 20% level for a second time this cycle, which touches the recession threshold (blue line). Hard data from the combined manufacturing and wholesale industries corroborate that supply has been in an outright decline, which defines an inventory correction, in each of 2023’s first three months (red line). Digging deeper, manufacturing/wholesale durable goods inventories posted an outsized $4.7 billion drop in March, while their nondurable goods counterpart declined for a fourth straight month; both are recessionary reads. This said, retail inventories have yet to flip to the red (green line), which flags further downside risk to the supply side when households hunker down.
Whether we’ve seen a full recognition on households’ parts is a matter of semantics given what we’re seeing in packaging. As highlighted a few months ago in a Weekly Quill simply titled, “The Indicator,” former Federal Reserve Chair Alan Greenspan’s go-to leading indicator was corrugated, a.k.a. boxes. On Tuesday, Packaging Corporation of America saw its stock price fall out of bed after announcing total corrugated paperboard shipments had fallen 13% YoY thanks to falling demand. QI’s friends at FreightWaves followed up with a doozie of a chart showing collapsing box shipments had taken out their 2009 lows.
The level of deterioration is evident in layoffs per day mined from dailyjobcuts.com running at eight-times the pace in 2022’s first four months. Closings per day, which notably exclude biggies like Bed, Bath & Beyond, are twice last year’s pace over the same period. As the website’s founder said Monday, “Tech inflated layoffs because they can do 5,000-20,000 at a time. Most companies don’t have 5,000 extra employees kicking around. It’s being portrayed that layoffs are “down” when in fact they’re just as bad and still going hot, which is surprising after six-plus months.” Initial jobless claims will keep rising.
Given the renewed scrutiny of bank loan books, on-edge bankers will be attuned to these fundamental signals and fade reassurances that the “U.S. consumer is strong.” The May 9th release of the Federal Reserve’s Senior Loan Officer Opinion Survey will be shunned by the few remaining “soft landing” holdouts. Critically, Fed officials will have the results of the survey in hand when they meet next Tuesday and Wednesday. They know that a further clampdown in lending standards will only depress already-impaired investment. If, despite the nation’s vitals worsening, Powell & Co. press forward with a rate hike, we’ll know the move was a (likelier than not, failed) attempt at hammering one more nail into the coffin of the Fed Put.