A Reprieve in Inflation Expectations is Not an Acquittal

QI TAKEAWAY While the risk asset rally could continue, we’d look to a disappointingly hawkish Powell at Jackson Hole later this week. Financial conditions have loosened to too great an extent and he is focused on headline CPI, which remains unacceptably high. We expect the layoff parade to continue and volatility to resurge while the flattening of the yield curve also resumes.

  1. The net of Good-Bad News Heard from UMich was 17 in August’s preliminary data, off the average of 9 from the last 3 months but well below April 2021’s 100; meanwhile, the recent gas price declines and equities rally have helped pull down consumer inflation expectations
  2. At 288 bps, the shadow fed funds rate is 58 bps north of actual, and $53 billion in QT to-date suggests roughly 1 bp in added tightening per $1 billion; against the backdrop of Other Deposits falling since March, markets seem blind to the risks as QT ramps up next month
  3. Stale listings, on the market for 30+ days, hit 61.2% of homes for sale in July, per Redfin, up from 54.4% last year; this is the first YoY increase in supply post-pandemic, and is evidence of liquidity depletion manifesting in housing as selling conditions rapidly fall off their highs

Sinking Inflation Reflects a Weakening Macro Backdrop

QI TAKEAWAY Color us dogs with bones. The unrelenting slowdown in the jobs market gives us little reason to cheer less bad inflation data. The notion that an earnings squeeze can be avoided with cost constraints at current levels is ludicrous. Take an optimist’s view: Look at this as a second shot at long-duration Treasuries. In other words, fade the steepening.

  1. Though both headline CPI and PPI saw historic MoM collapses when measured as z-scores, the Fed still has a long way to go to bring rates back to neutral; July’s data saw deflationary turns in travel, with car rentals, airfares, and hotels all seeing a pullback in pricing power
  2. While initial jobless claims troughed in mid-March and have risen at their fastest pace since 1968, continuing claims did not bottom out until mid-May; the stickiness of this cohort will put a damper on aggregate spending capacity as the ranks of the Insured Unemployed swell
  3. 1969 saw continuing claims trough at the end of May, and given the recent pick-up in layoff announcements, a catch-up to this historical precedent should be swift; however, in the face of the current weakening labor market, stocks appear to be rallying prematurely

Inflation: Fairweather Friend to Investors, Arch Enemy of Households

QI TAKEAWAY Investors cheered lower-than-forecast inflation. But household purchasing power continues to get clobbered. Delinquency rates have bottomed prompting banks to preemptively tighten lending standards in anticipation of rising joblessness. Watch today’s jobless claims for continuing validation of this trend.

  1. The MoM and YoY prints for core and headline CPI came in below expectations in July; the ensuing rally saw the yield curve twist steepen with longer-term yields rising, while the USD fell more than 1% as investors hoped for a decreased probability of a September 75-bps hike
  2. Nondiscretionary CPI inflation fell from June’s high to a 10.0% YoY rate, but was still only the second double-digit print in data back to 1998; meanwhile, workers continue to feel budgets pinched, with average weekly earnings only going up 5.3% YoY at the same time
  3. New delinquent loan balances for all household loan types rose to 2.41% in Q2 2022, per the NY Fed, the highest since Q4 2020; loan officers appear to be anticipating unemployment going up, pulling back to a net 5.2% of banks in Q2 willing to make loans to consumers

Small Business Weakness Bleeds into Bigger Investing Picture

QI TAKEAWAY Inflation hasn’t been this big of a concern on Main Street in about 50 years. The current set up contrasts low sales concerns with high future top-line pessimism and a weakening pricing power picture. We are revisiting our depth of inversion call: Be prepared for the 2s/10s yield curve to test the -50 to -100 range and what a development implies for credit.

  1. In the NFIB’s July survey, 37% cited inflation as their biggest challenge, the highest since Q4 1979 and a 3.9 z-score; meanwhile, ISM Production Material Lead Times are currently at a 2.9 z-score, not seen since the 1970s, as supply chain woes continue to plague Main Street
  2. The Expected-Current sales spread in NFIB data was at a net -29% in July, one of the lowest readings on record; despite the current sales print of a net -5%, the future outlook was far more pessimistic and signals that there’s likely more room for the 2s10s yield curve to fall
  3. At a net -19%, the difference between pricing plans, at a net 37%, and current pricing, a net 56%, hit a 50-year low in July; though hiring costs have squeezed margins, Paychex’s Small Business Hiring Index fell for a fifth straight month in June, flagging easing wage pressures

Productivity Cratering

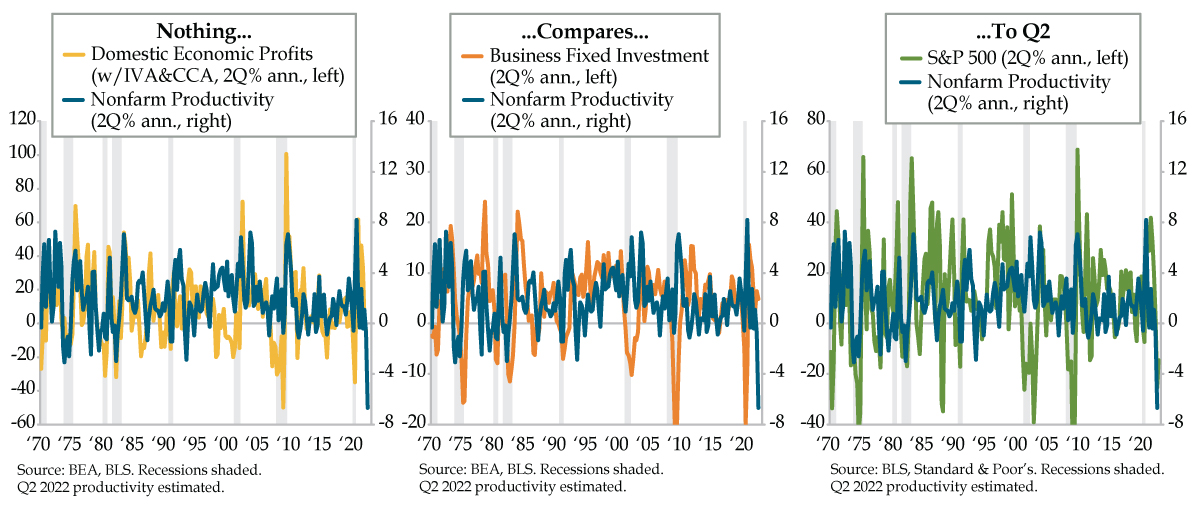
QI TAKEAWAY The fallout from the first-half collapse in nonfarm productivity should lead to downgrades to profit and investment outlooks, a bearish development for equities.

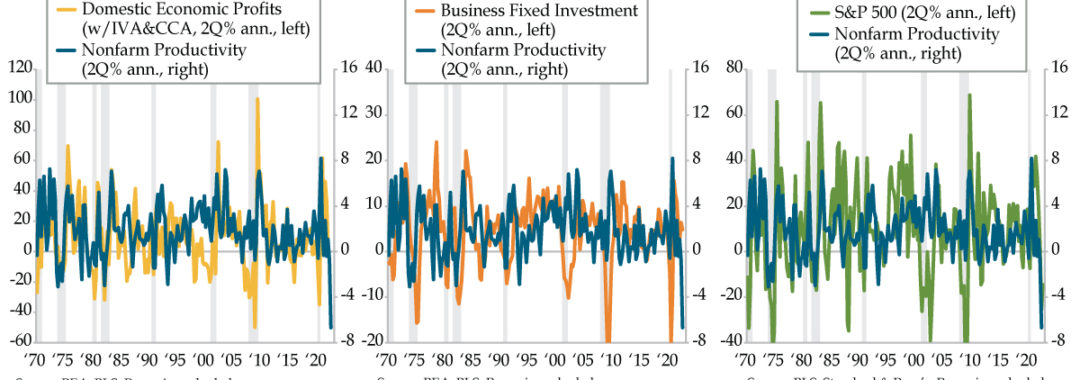
  1. The consensus for Q2 nonfarm productivity is -4.6% QoQ, which would yield a two-quarter annualized plunge of -6.0%; however, QI is predicting a -6.7% print, as hours worked are likely to land above the 2.5% consensus, after Q2 private nonfarm hours rose 3.4% QoQ
  2. Per the BEA, Domestic Economic Profits track with productivity, and a record decline in the first half of the year should ignite fears of an earnings recession; given their historical relationship, falling productivity should also drive a pullback in Business Fixed Investment
  3. Despite the S&P 500’s -15% annualized performance in the first half of 2022, historically weak productivity should continue to weigh on equities; sell-side optimism will be drowned out as more firms join Allbirds, Groupon, and Warby Parker to cut labor costs via layoffs

The Used Car Market Foundering Badly

QI TAKEAWAY It’s conceivable that Wednesday’s headline CPI reflects both demand destruction in energy and sticky and high shelter inflation, a classic stagflation print. Given nothing systemic has broken in the credit markets, investors are premature in assuming Powell has already pivoted. We look for the yield curve to stay deeply inverted as markets wake to that reality.


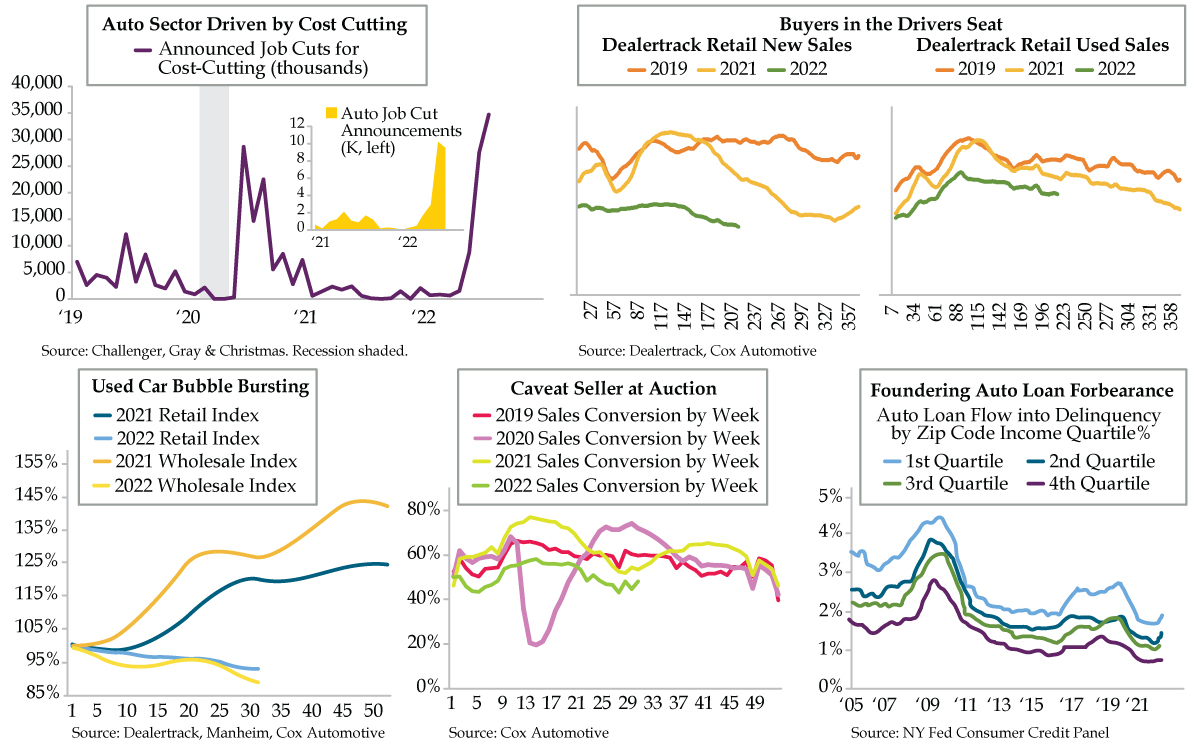
  1. Consumer credit hit $40 billion in June vs. the expected $23.8 billion, with non-revolving credit, dominated by auto loans of late, driving the increase; meanwhile, NY Fed data shows auto delinquencies have begun to rise across income cohorts, affecting more than just subprime
  2. As lending standards tighten, new and used car sales should continue to decline, as seen in data from Cox Automotive; prices should also turn, given the average daily sales conversion rate fell to 47% last month vs. 2019’s 57% and the pandemic peak of 74% from mid-2020
  3. Per Challenger, Gray & Christmas, the automotive sector is leading all industries in job cut announcements this year; underneath Friday’s 528,000 job gain headline, 1,000 jobs were cut by auto dealers, a trend which should accelerate as sales fall and repossessions tick up

QT is Not Phantasmic

QI TAKEAWAY Jobless claims continue to march slowly upwards. Even so, financial conditions have greatly loosened predicated on hopes that Powell has already pivoted. The easier conditions, the more the Fed has to re-tighten to achieve its current primary stated goal of taming inflation. While not our base case, it would not be out of the realm of possibilities for the Fed to execute an emergency rate hike following next Wednesday’s CPI report given it will be another six weeks before the September FOMC. We reiterate our flattening call ahead of tomorrow’s jobs data.

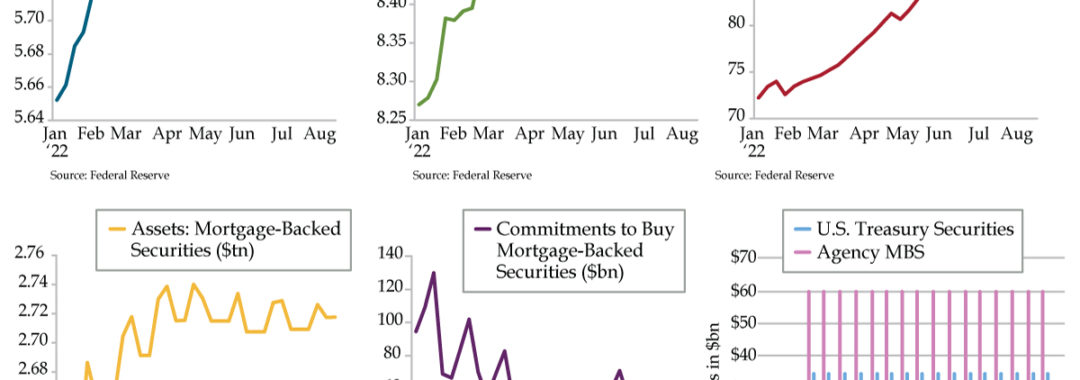
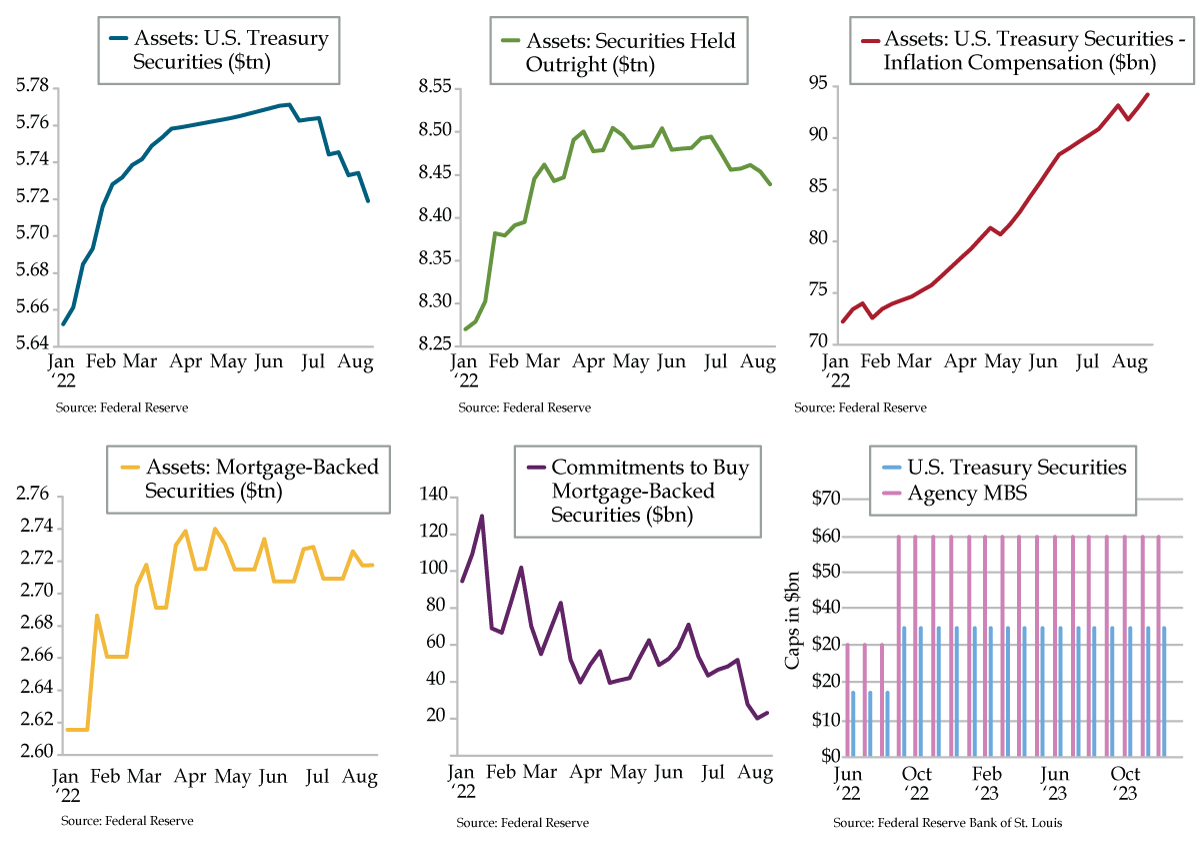
  1. QT is well underway at the Fed, despite balance sheet technicalities that make it appear as if it’s not the case; inflation adjustments on TIPS have revised principal amounts upward, and Treasury holdings decline only discretely at mid-month and end-month, when notes mature
  2. The Fed’s MBS holdings appear up-and-down on the balance sheet because purchases settle on the 15th while principal repayments settle on the 25th of every month; delayed settlements over the last 3 months have also obscured the steady drop of the Fed’s MBS holdings
  3. Once we hit September and all past-purchased MBS settle, expect to see the balance sheet clearly and steadily decline each month; lastly, if the Fed were to ever sell MBS outright and incur losses, expect QT to shift to Treasuries to make up for any MBS QT deficits


ISM Bad Breadth Points to Deeper Inversion

QI TAKEAWAY — Slower growth, a loosening labor market and lower inflation were all evident in the worsening breadth of industries in both ISM reports. A twist flattening of the curve should lead to even greater depths of yield curve inversion.

  1. At 56.7, ISM’s Services headline index hit a three-month high in July and beat all 60 estimates in Bloomberg’s survey; despite the expansion, only 13 of 18 industries saw growth vs. all 18 in June, and 3 contracted outright, including Retail and Finance & Insurance
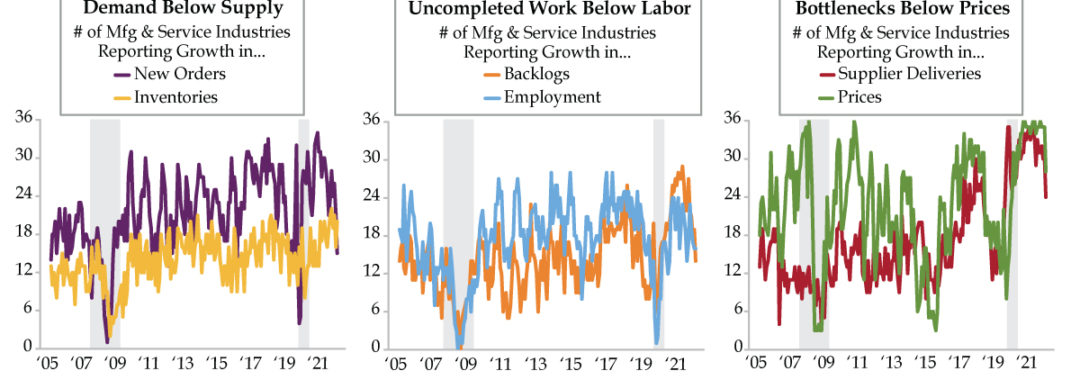
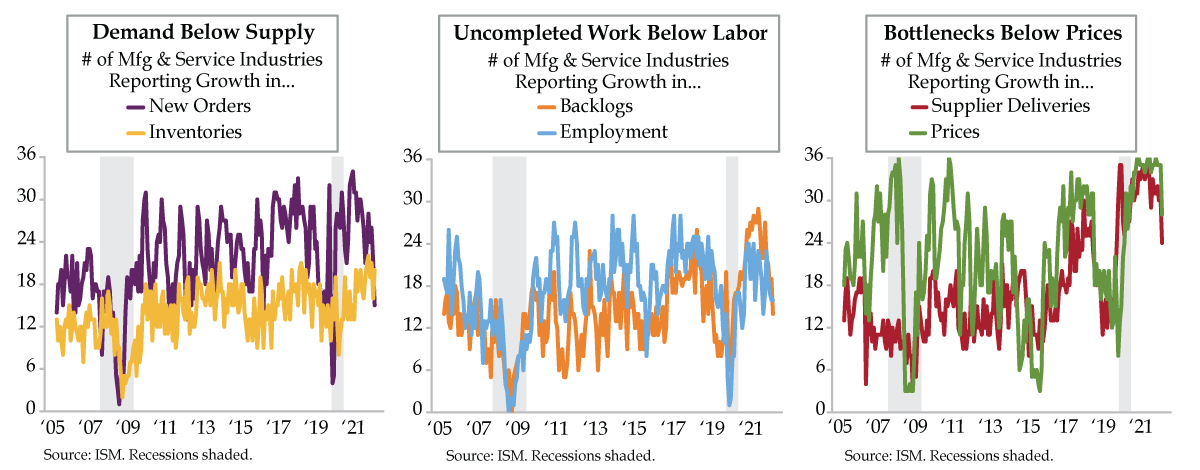
  2. Looking across ISM’s Mfg and Services surveys, just 15 of 36 total industries saw expanding future demand vs. 28 in March and the long-run average of 21; meanwhile, 20 industries had expanding inventories, on par with the six-month average but above the long-run of 14
  3. The number of industries with expanding Employment outpaced those expanding Backlogs, signaling a waning demand for future labor; 24 industries saw longer delivery times and 28 seeing higher prices, both sharp falls from June, providing additional deflationary signals


Calling Out the CAD

QI TAKEAWAY — Weakness in Canada’s economy is a mirror image of that of its neighbor to the south. Vis-a-vis the more optimistic FX analyst community, the Canadian dollar that is likely to underperform in 2022’s second half.

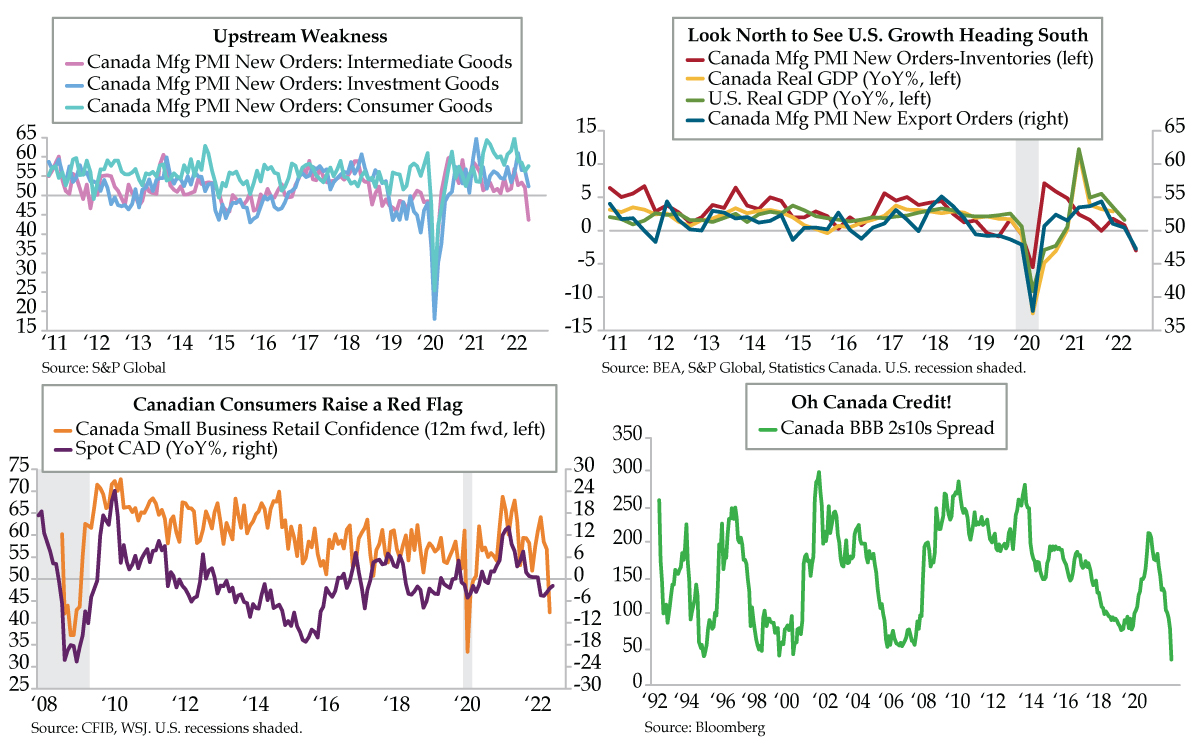
  1. Canada’s headline PMI fell to a 25-month low in July while New Orders and Output, at 48.8 and 48.9, respectively, contracted for the first-time post-pandemic; driving the weakness was upstream, with Intermediate Goods New Orders falling to 43.7, ending 25 months of growth
  2. Thus far in Q3, Canada Mfg PMI New Export Orders are in contraction after Q2’s modest 1.6% YoY print; given 75% of Canadian exports go to the U.S., the weakness is flagging recession stateside as is the New Orders-Inventories spread, now at a post-pandemic low
  3. At 33.1 bps, Canada’s BBB 2s10s spread is now at a record low, flagging credit market risk for our Northern neighbor; while Bloomberg’s consensus recession probability for Canada is 30%, CAD could weaken through year-end despite current optimism from FX forecasters


Construction Job Risk Cements Cyclical Turning Point

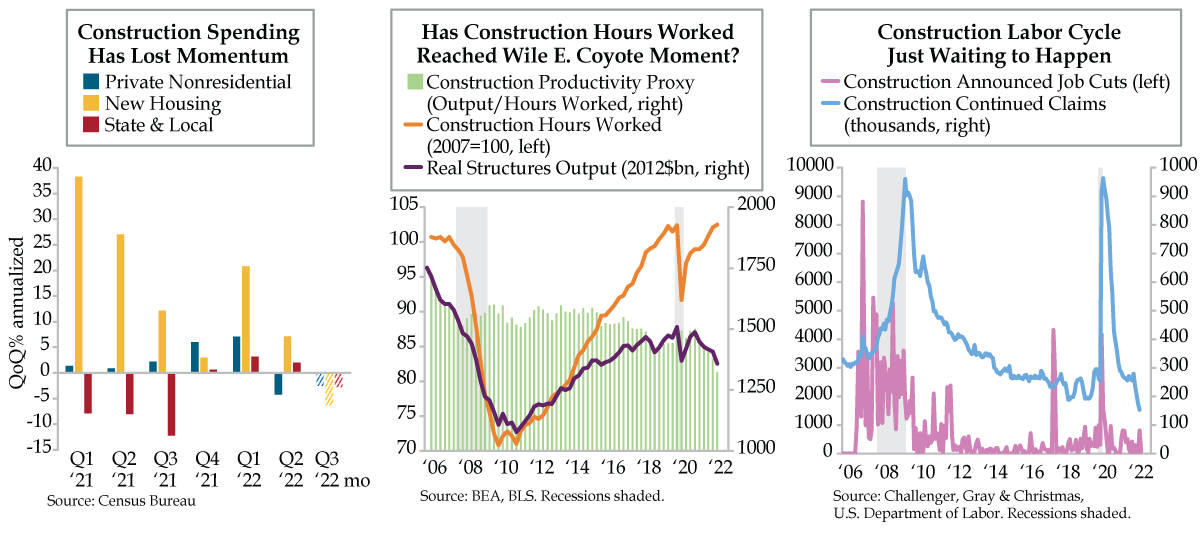
QI TAKEAWAY — The construction sector is labor intensive. Disappointing spending data at second-quarter’s end and contracting productivity raise the risk for near-term layoffs in construction. A jobless picture weighted more toward construction could move the needle on an extraordinarily stable unemployment rate.

  1. Headline construction spending, per the Census Bureau, fell 1.1% in June vs. the +0.1% consensus from Bloomberg; of the three key sub-sectors, private nonresidential fell 0.5% MoM, a fourth monthly decline, while new housing fell 2.5% and state & local fell 0.6%
  2. Real Structures GDP has been in decline for five straight quarters, hitting -6.3% YoY in Q2, while Construction Hours Worked have actually risen; given construction is labor-intensive and lower-productivity, this boom in hours could be vulnerable as investment rolls over
  3. Excluding 2020, Construction, on average, accounted for more than 25% of the decline in nonfarm payrolls in all recessions since the mid-1970s; though layoffs have not yet risen and continued claims hit a cycle low in May, risk remains that the sector sees its fortunes turn