A Successful Failure

“Survive we did, but it was close. Our mission was a failure, but I like to think it was a successful failure. Apollo 13, scheduled to be the third lunar landing, was launched at 1313 Houston time on Saturday, April 11, 1970; I had never felt more confident…Looking back, I realize I should have been alerted by several omens that occurred in the final stages of the Apollo 13 preparation…. Oxygen tank No. 2 blew up, causing No. 1 tank also to fail. We came to the slow conclusion that our normal supply of electricity, light, and water was lost, and we were about 200,000 miles from Earth. We did not even have power to gimbal the engine so we could begin an immediate return to Earth. The message came in the form of a sharp bang and vibration. Jack Swigert saw a warning light that accompanied the bang, and said, ‘Houston, we’ve had a problem here.’” – Apollo Expeditions to the Moon, James A. Lovell

For dramatic effect, 1995’s Apollo 13’s screenwriter William Broyles Jr. changed the famous quote to, “Houston, we have a problem.” Today, Houston and the rest of the state of Texas, has a problem – verb present tense. It’s that inflation has got everyone on alert for the dreaded wage/cost-to-price spiral. The Dallas Federal Reserve’s March business outlook surveys illustrated the anxiety via special supplemental questions. Today’s twin bar charts reveal the emergence of persistent inflation from the beginning of the production process to the end of the distribution chain.

In manufacturing, annual wage costs in 2021 and expected in 2022 are running at nearly double that of 2019 and 2020. Input costs (excluding wages) have accelerated more quickly as supply chain disruptions continue to constrain roughly three-in-four Texas producers. Price adjustments have quickened to five times the pre-pandemic rate. The follow-through from selling prices suggests a wage/cost-to-price spiral is unfolding.

There’s a similar picture in retail. Wages are expanding at a 7% annual clip while those net of wages vaulted to 13% last year; they’ve since fallen back to around 9%. The resultant rising consumer prices speak to the Fed’s challenge to get inflation back to its 2% target. Retail inflation of 2.5% to 3% in 2019 and 2020 vaulted over 12% in 2021, but also has settled near 9% in 2022. The absolute level is still running three times too hot even as discretionary wherewithal is crumbling.

When queried, “what is the net impact of recent higher energy prices on your business?” 74% of Texas retailers saw a slight to significant impact, while only 5% indicated positive effects. Expanding further, Lone Star state retailers were asked what the net impact of the Russia-Ukraine war was on their business, 31% answered negatively, while again just 5% leaned positively (we’d like to meet that 5% that found war to be a boost).

Our praise for Texas as a key manufacturing hub has been a constant over the years – the vista from our Dallas HQ provides a convenient vista. For all of the details we’ve shared over the years, we share for the first time that more than eight cents of every dollar American expended is within its borders. For the key cyclical auto sector, the footprint is even bigger. According to the Texas Department of Motor Vehicles, there are more than 2,500 licensed new (franchise) vehicle dealers across the state. All told, Texas accounted for 11% of 2020’s new vehicle spending, eclipsing the larger state of California for the second year in a row.

To take but one example from Rodeo Drive, Dallas is the Maclaren capital of the country. It’s true…there are more than big pickup trucks down here. There is a booming import car market as well, which brings us to last Friday’s German IFO survey, which slammed estimates. The war in Ukraine drove a record decline in business expectations across the German economy. To diverge from our theme for just a moment, unlike during the trade war days when it was a standout economic diversifier, construction expectations also got shellacked.

As for manufacturing, at -40.5, the net difference was also worse than IFO’s headline; the motor vehicle industry got hit even harder with a one-month swing a nasty -57.5 points. It’s little wonder German auto export expectations plummeted in March (purple line). Texas’s mammoth auto dealer footprint naturally makes it sensitive to the ups and downs of Germany’s Big Three brands — BMW, Daimler, and Volkswagen. To that end, Texas retail future inventories (orange line) have had a .67 correlation since 2016.

Rising auto loan rates will only act as an additional governor on new car sales. In this year’s first quarter, Bankrate’s 60-month new auto loan in Texas has already skipped up by a half a percentage point. A follow through on the Fed’s hiking cycle threats in coming months would hypothetically further pressure the top line even as employers continue to carry high labor costs. As you will hear with greater frequency, unemployment is the most lagging of all economic indicators; relief on this front won’t come soon enough to preserve margins.

On a more fundamental level, Texas auto dealers have a hard time selling what German automakers can’t export. Consensus estimates for Friday’s March vehicle sales point to a 13.9 million seasonally adjusted annual rate, down a smidge from February’s 14.1 million. We’ll take the under.

Housing Continues to Weaken

QI TAKEAWAY — The last several weeks’ data have left no gray area – interest-rate sensitive sectors are feeling the heat of rising rates and tightening financial conditions. While this week’s heavy Treasury supply could keep upward pressure on long-end rates, we believe the long-run lagged relationship of collapsing sentiment and a rising unemployment rate will hold as the U.S. economy succumbs to stagflation.

  1. A mid-January survey by Clever Real Estate found that 82% of millennials had at least one significant regret about becoming homeowners in the post-COVID rush to the exurbs; at 40%, the most cited regret was buying in a poor location, while 30% cited cost of upkeep
  2. After rising an average 18% YoY in the five months through May 2021, pending home sales have averaged 6% YoY declines over the last nine months; the fact that Sherwin-Williams stock price peaked at the same time is indicative of the shift towards purchases by investors
  3. Upper income household views on home and stock portfolio values, per UMich, fell into negative territory in March for the first time since late 2020; given buyers also no longer favor buying in advance to avoid further price and rate increases, further downside is likely

Front Wing vs. Rear Wing

For speed demons that can hit 250 miles per hour, Formula 1 (F1) design shifts are glacial. As author of Red Bull RacingMatt Youson wrote, “F1 is a sport of evolution, rather than revolution, with an annual nip and tuck to improve safety, cut costs or seal loopholes. Genuine change is rare – but when it comes, it tends to be epoch-defining, marking the end of an era or the start of a dynasty. In that context, the changes wrought at the start of 2022 are immense: quite possibly the most ambitious transformation in the history of the sport, certainly the biggest in the last four decades. It’s a new era of F1.” Even F1 tourists can spot the dramatic changes. The new tires are massive; they’ve widened from 13-inch to low-profile 18-inch rims. And it’s tough to choose – is the redesigned front or rear wing more eye-catching? The enormous front wing resembles a steely handlebar moustache. But it’s the raised rear wing that’s most visually transformative. Rejiggering the design pulls exhaust up instead of as back did past versions, which spewed wake into the face of whomever was riding your tail.

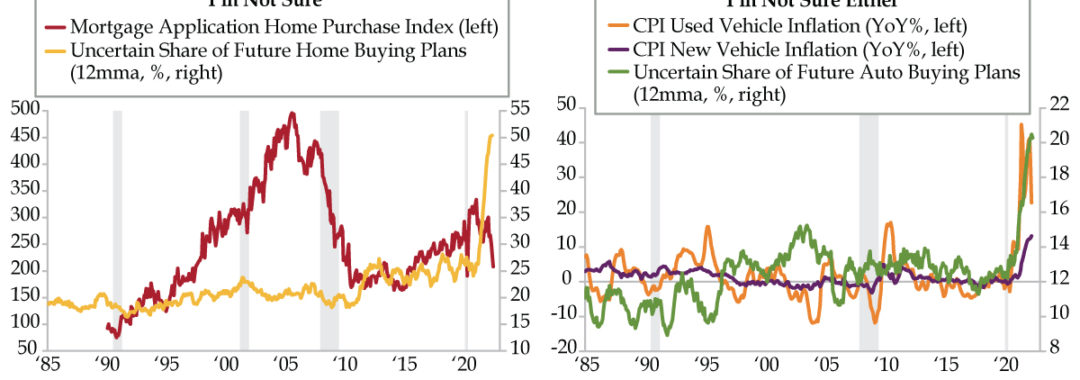
A gamechanger is how many described the demographic wave of would-be millennial homebuyers who rushed to the suburbs and exurbs following the Covid 19 outbreak. A mid-January survey by Clever Real Estate found that 82% of the biggest age cohort in America had at least one significant regret about having made the plunge into homeownership. This compares to a Bankrate survey from June 2021 whose findings showed 64% of millennials regretted becoming homeowners. Call it ‘bidding war remorse’ as so many have infamously paid well over asking prices for fixer-uppers in less than desirous neighborhoods – a multifaceted blow to budgets as the mortgage payment and costs to repair and upkeep a home compete for top spot as the most burdensome.

It’s clear that essentials inflation has arrested the refurb surge, which stands to reason as food and utility inflation impair after-tax incomes regardless of where you live. Making matters worse, many former urbanites have been called back into the office. Between the cost of the (record high price) car payment and fast rising pump prices, that roundtrip trek to work, from what many consider to be the decidedly unhip hinterlands, is on the rise. This especially pours salt in the wounds of millennials, 40% of whom said their biggest regret was buying in a bad location, the highest-ranked regret. Tied at 30%, the second and third biggest regrets were bad neighbors and cost of upkeep. Just wait until the cost of replacing that HVAC collides with what’s not covered by car warranties – think tires and brake jobs, which will pile onto recent millennial buyers’ misery given 27% report the value of their home has already fallen.

Of all the broad indicators, pending home sales (orange line) best reflect the state of the organic housing market. Consider that homes purchased by investors are never ‘pending’ as they’re inhaled before being listed by slick techie investors who make livings cold-calling existing homeowners. You clearly see the post-pandemic spike, which averaged 18% year-over-year growth in the year to May 2021; this has been followed by nine months averaging 6% declines in pending home sales – this is the baton handoff from those buying to live in a home to investors who want to rent them. It’s no coincidence that the stock of Sherwin Williams (purple line) peaked at the same time.

We would also note that souring views on housing are led by those in the middle- (yellow line) and upper-income (red line) terciles who, according to the Bureau of Labor Statistics, account for a combined 78.1% of spending on Owned Dwellings. With full disclaimer that we’re no stock pickers, it’s curious that the trend in the stocks of the big two home improvement retailers (green line) has been relatively resilient vis-à-vis the collapse in homebuying sentiment.

One thing is for certain – fence-sitters are not jumping en masse. On Friday, Richard Curtin of the University of Michigan (UMich) noted that, “Despite the dominance of rising prices, few consumers now favor buying-in-advance to avoid anticipated price increases, and few consumers favor borrowing-in-advance to avoid future interest rate hikes, despite the consensus view that prices and interest rates will continue to rise. This is quite unlike the last inflationary age when advance buying promptly gained favor at the first signs of inflation in the late 1960s.”

Some context: In the 1960s and 1970s, the U.S. household saving rate ran at about 12%; the mid-2000s housing bust, which was followed by the Federal Reserve’s post-2008 zero interest rate policy, halved that to roughly 6%. Moreover, the bulk of that cash stash resides in the hands of older Americans who already own homes, not the targeted millennial age group.

We sense further downside is in the making. Buried in the weeds of the UMich data are upper-income households’ takes on their homes and stock portfolios’ values (light blue line), a wealth proxy, or if you would prefer, wealth effect proxy. In March, this gauge fell into the red for the first time since late 2020. Given the S&P 500 is so close to its all-time-high, this is nearly as surprising a turn as Lewis Hamilton not qualifying for this past weekend’s latest F1 run. It would seem revolutionary design changes can indeed shake dynasties.

Supply Chain Easing Defying Headlines

QI TAKEAWAY — The relief rally in PMI data should be viewed as a macro blow-off top, in our view. The direction of various confidence measures is steeply in the other direction, led by the biggest spending, highest-income earners, a sign that spending is at risk. These rallies should be treated as opportunities to pare risk.

  1. Per Edmunds.com, 82.2% of auto purchases were above MSRP in January vs. just 2.8% in January 2021; helping drive price gouging were supply chain issues and the semiconductor shortage, which could be set back given Ukraine supplies about half of the world’s neon gas
  2. Manufacturing Delivery Times rose to 28.7 in S&P Global’s Flash PMI data for March after troughing last July at 16.5; momentum suggests procurement challenges are fading, further evidence that demand destruction has also driven the last six months’ decline in auto sales
  3. Financial Vulnerability for those making below $50,000 fell more than the last two months, per Morning Consult’s, to just two points above the pre-pandemic average; however, those making above $100,000 see their vulnerability as jumping 57% to a post-pandemic high

Liquid Fire

Before there was electricity, there was neon. In 1675, French astronomer Jean Picard noted a faint glow emanating from a mercury barometer thermometer that had been shaken, not stirred. The cause was static electricity, which couldn’t have been known at the time. More than two centuries on, this rare gaseous element got its fair due, and was named after the Greek word “neos,” meaning new gas. The dynamic duo behind the 1898 discovery are Scottish chemists William Ramsey and M. W. Travers who were rare hidden gas hunters, a sport at which they excelled. They also discovered krypton and xenon alongside neon by isolating the gases from liquified argon. Credit for how we came to know neon goes to French engineer, chemist, and inventor Georges Claude, who, in 1902, was the first to apply an electrical discharge to a sealed tube of neon gas to create a lamp. Commercialization arrived in 1923 when Claude Neon sold two neon signs to two Packard car dealerships in Los Angeles. The public was instantly mesmerized at signs that even glowed during the day, a feature that earned neon its nickname of “liquid fire.”

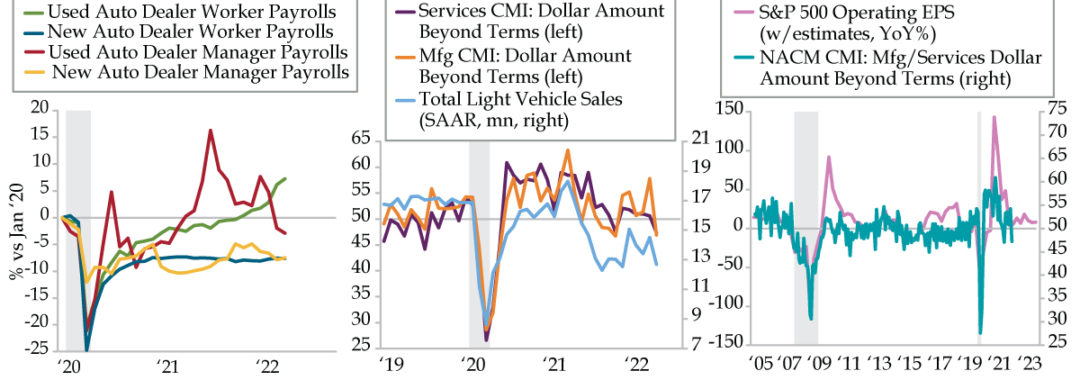
While they no longer sell Packards, U.S. auto dealerships have been able to save on advertising signage in recent years in response to the extraordinary marginal demand for autos catalyzed by the exodus to the exurbs. And while the semiconductor shortage, exacerbated by the pandemic-induced supply disruption, has deprived dealers of inventory, it’s also opened the door for blatant extortion, as hefty premiums over Manufacturer’s Suggested Retail Price (MSRP) have given new meaning to “price gouging.” Per Edmunds.com, this past January, 82.2% of purchases were above MSRP; that compares to just 2.8% in January 2021. GM and Ford have warned dealers they will be penalized if the practices are not arrested.

As stiff as production challenges have been, the global supply of neon gas, a requirement to make laser lithography in semiconductor manufacturing, is concentrated in Odessa, Ukraine. As detailed by Cass Information Systems in its February freight report, “These gases, purified in Ukraine but generated in Russian steelmaking, supply roughly half of the world’s neon, according to various estimates, and ~90% of U.S. chip-making neon supply.” According to Technet, the specialty chemical consultant that procures the data, supplies of nickel, palladium, and other commodities would also be at risk because of the war, which we’ve certainly seen splashed across the headlines in recent weeks.

This said, as we’ve flagged, there’s more than a supply shortage at work in the last six months’ declines in auto sales. Thursday morning’s data added to growing evidence that a demand deficit is a key driver. Cocooned in S&P Global’s Flash PMI data for March, which showed activity across manufacturing and services rose to an eight-month high, was the welcome news that the supply chain is loosening. After troughing last July at 16.5, manufacturing Delivery Times rose to 28.7 (purple line, depicted inversely). Though not normalized vis-à-vis the pre-Covid trend, the direction and momentum suggest the challenge in procuring goods is quickly dissipating. Rather than spur Light Vehicle Assembly (orange line) higher, which should have been the case if automakers were keen to catch supply up to demand, February production fell to a five-month low.

Car manufacturers have made no secret they’re keen to preserve margins, which has been facilitated in large part by rising prices. Flooding the market with supply in the face of faltering demand would be the quickest route to eroding profits. On a more fundamental level, the slippage to a five-month low in the PMI data was driven by the services sector. As the report noted, “firms highlighted the potential impact of reduced disposable incomes at customers following hikes in the cost of living.” This description captures how stagflation manifests.

A preview to today’s final print on the University of Michigan’s March consumer sentiment landed on our radar in the form of a great dataset produced by Morning Consult, which we suspect will become a mainstay in the economics community in the aftermath of the pandemic. Released Wednesday, the consultancy’s monthly Inequality Index, co-released with Axios, provided some encouraging insights on the improved financial security among lower income workers who’ve reaped the rewards of higher pay in recent months. Despite inflation being the most regressive of taxes, the bottom tercile’s Financial Vulnerability (green bars) has, in fact, declined over the last two months and is now only 2 points above the post-pandemic average. Middle income earners (yellow bars) have indicated a relatively low 20% erosion in their vulnerability over the same period.

Those making $100,000 or more (red bars), however, perceive their vulnerability to have jumped by 57% to a post-pandemic high. As the release observed, the more downtrodden view stems from this cohort being, “more financially savvy.” They’ve “seen market volatility eat away at their wealth amid a broad decline in stock prices since the beginning of the year.” Forecasters must heed these divergences as the top tercile of earners accounts for 53% of aggregate spending and 55% of new car purchases. As farfetched as it may sound to cite jobless claims, which are at the lowest level since 1969, these are the same folks in charge of hiring and firing decisions. We know labor is roughly two-thirds of a company’s cost structure. Cuts to this line item will occur well before the neon advertising budget is exhausted.

Bon Voyage Seller’s Market

QI TAKEAWAY — Investors crowded into residential real estate in 2021 as inflation trades were all the rage. That changed at the end of last year as the Fed prepared to tighten, which put sellers on notice. The mere threat of full hawk this week is enough to cajole the most ardent sellers to capitulate.

  1. Home selling conditions, as tracked by UMich’s Survey of Consumers, hit a record high of 168 in February as the housing sector hit maximum bullishness; new single-family homes were on the market a median 2.5 months in February, a record low in data back to 1975
  2. Fed language has helped push the Freddie Mac 30-year rate up 105 bps from the end of 2021; changes in Powell’s rhetoric from describing Fed actions as “gradual” to “expeditious” signal the Fed is no longer willing to let runaway home price appreciation continue
  3. Investors’ share of new and existing home transactions has risen to 33% in 2022 from 30% seen the past two years; meanwhile, demand for vacation homes, per Redfin data, is down to its lowest level since May 2020, though it still remains 35% above pre-pandemic levels

Timing is Everything


“I can’t believe that even the most rabid chick-flick masochists wouldn’t gag on it.” – Peter Travers, Rolling Stone(November 2006)

“The last time Bullock and Reeves were together on screen the result was Speed. This should have been entitled Stop.” – Mark Kermode, Guardian (June 2006)

“The time-warp romantic fantasy The Lake House is a puzzle that is maddeningly obtuse, emotionally overstretched and virtually absent a sense of interior logic.” – Jack Mathews, New York Daily News (June 2006)


Ouch times three! Critics excoriated the flick featuring Sandra Bullock, a lonely doctor who once occupied a beautiful lakeside home, who begins to exchange love letters with its former resident, a frustrated architect. When they discover they’re living two years apart, the pair must unravel the mystery behind their extraordinary romance before it’s too late. You’re not obtuse if you couldn’t follow such a convoluted plot, which was never unwoven in the film’s 1-hour, 39-minute play time.

In investing, timing the market is hard enough. And plotting out perfectly timed narratives is all but impossible. Luckily, gauging turning points in macro narratives doesn’t command near the same level of acuity. Today, we’re game enough to give it the old college try.

The seller’s market in the U.S. housing sector reached its maximum bullish point in February 2022. There. We said it. Please enter into evidence Exhibit A – record high home selling conditions (yellow line). This University of Michigan metric, which tracks home sales better than its sister gauge of home buying conditions, hit a level of 168 in February. That translates to a net 68% of homeowners who say it’s a good time to sell.

Sellers have been reaping the rewards of seriously grabby buyers leap frogging one another and paying six figures over asking prices in a hot panic. (QI’s Dr. Gates can personally attest.) To that end, though not illustrated, new single-family homes were on the market a median 2.5 months since completion on an unadjusted and adjusted basis in February (inverted blue line), the lowest reading since the series inception in 1975.

This dynamic is poised to shift. The Fed’s waxing Volcker (we reiterate doubts harbored until we see actions back words) has helped to noticeably tighten financing conditions in 2022. Freddie Mac’s 30-year fixed mortgage rate rose 105 basis points from the last week of 2021 through the week of Fed lift off, pushing rates from 3.11% to 4.16%. The Fed doesn’t control mortgage rates, but it can influence them with threats to aggressively slough mortgage-backed securities off its balance sheet.

Since we’re on the topic, Fed Chair Powell’s answer to a question in last Wednesday’s presser was instructive: “As we raise interest rates, that should gradually slow down demand for the interest sensitive parts of the economy. And so, what we would see is demand slowing down, but just enough so that it’s a better match with supply.” The operative word here is: “gradually.”

On Monday, Powell upped his adverbial stance: “There is an obvious need to move expeditiously to return the stance of monetary policy to a more neutral level, and then to move to more restrictive levels if that is what is required to restore price stability.” The operative word here is: “expeditiously,” which slaps last week’s gradual narrative in the face.

For most of 2021, residential real estate was the answer to the inflationary plague. Before the year ended, the nemesis had changed to a place to hide from the rate shock. That’s since segued to war game trading and nervous recession chatter. Empty rhetoric or not, Powell’s turning up the volume on the rate shock trade signaled the Fed no longer backs house price appreciation running off the rails. Begrudgingly or not, he knows he’s done anything but make policy in the “public interest” as he’s legally obliged to do.

To that end, investors’ share of new and existing home transactions rose to 33% in 2021 from 30% in 2020 and 2021; that’s a step up from readings in a range of 26% to 29% from 2012 to 2019 (bottom chart). Top that with Redfin data which depict demand for vacation homes collapsing to the lowest level since May 2020 last month (top right chart).

As dramatic a turn as that may sound, perspective is key. Benchmarked to pre-pandemic levels, second-home demand was still up a cumulative post-pandemic 35% last month. Still, that’s significantly lower than the 87% peak sported in January. According to Redfin, rising mortgage rates clashing with record home price appreciation have hit the second-home market much harder vis-à-vis its primary market counterpart. We have our doubts as to that causal link. We get that vacation homes define optional. But we suspect the tie that binds is the stock market.

At times like these, it’s beneficial to have the nation’s best housing soundboard a keystroke away. Per Ivy Zelman, “While it is clear current sales are being impacted by intentional sales limitations, homebuilders appear optimistic about the prospects for future demand and seem to be extrapolating current strength. Notably, homes authorized but not yet started continue to ascend toward 2006’s all-time peak as homebuilders prepare to significantly ramp speculative home production, seemingly downplaying potential demand degradation as home prices continue to rise double digits on an annualized basis and mortgage rates spike.

We would say, “The plot thickens.” But we know how this movie ends. The seller’s market is turning…

Industrial Recession Risk from Richmond

QI TAKEAWAY —  Industrial, trade and broader economy working hour downside risks are building in the Richmond Fed District. Other regional survey outlook indices have gained in importance this month and bear close monitoring for further evidence of the emerging industrial recession narrative.

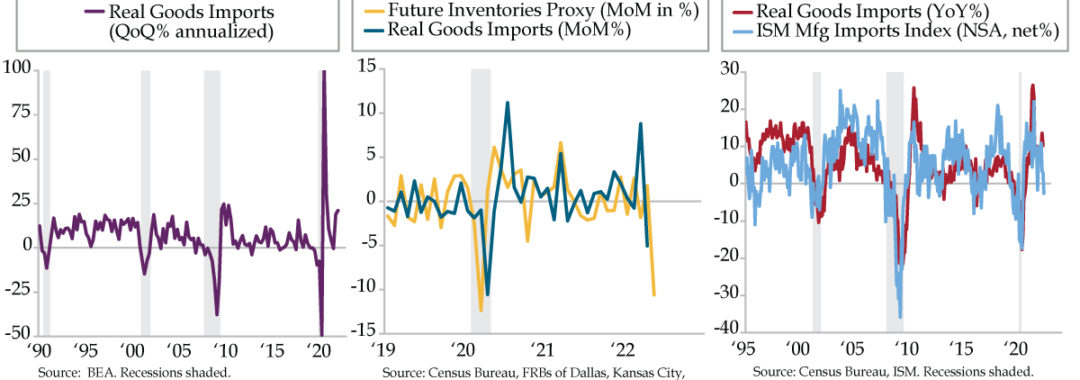
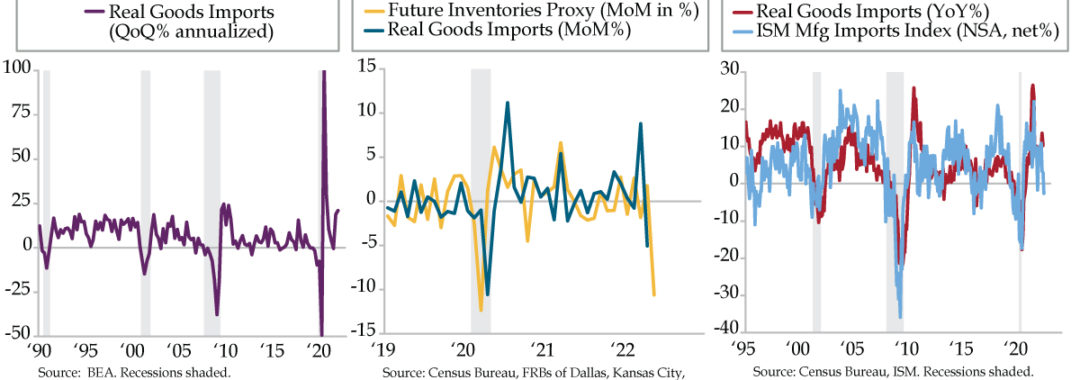
  1. Total trade across the ports of Baltimore, Charleston, and Virginia, per the Richmond Fed, fell 4.6% YoY in January, the first decline since August 2020; outbound containers saw an outsized 18.7% YoY drop, while imports doubled the level of exports for the first time
  2. Manufacturing Expected New Orders fell to 11 in March, not seen outside of the Great Recession and initial COVID shock; the read, which translates to a -2.2 z-score, is a large outlier, and further downside to is likely in light of recent shocks to energy and commodities
  3. The Services Expected Workweek fell to 9 in March from February’s 18, the lowest since last January, while manufacturing collapsed to 0 from last month’s 17; also echoing a slowdown was the HPS-CivicScience Sentiment Index, falling 1.8 points in March to a record low 36.3