Category Archives: Uncategorized


Weekly Quill — The Economic Betrayal of the American Public
QI Research proudly announces a significant milestone: a decade of providing independent, data-driven macroeconomic strategy and analysis. The firm was founded in 2015 by Danielle DiMartino Booth following her departure from the Federal Reserve Bank of Dallas, where she served under President Richard W. Fisher. Upon leaving, she launched the firm—originally branded as MoneyStrong—with a vision to offer deep, unfiltered economic insights.
We humbly credit our success to you—our loyal clients and the growing community of those who’ve joined the #ResearchRevolution. In celebration of this milestone, we’re pleased to extend, for the first time, a limited-time discount to The Daily Feather and our premium institutional newsletter, The Weekly Quill.
To receive 20% off your first annual subscription to QI Pro, sign up HERE:
https://quillintelligence.com/register/weekly-quill-annual/
When checking out, use this coupon code: QITenYears
To receive 20% off your annual subscription to The Daily Feather via Substack, visit:
https://dimartinobooth.substack.com/QITenYears
As a preview of what QI Research offers: a seminal missive on the betrayal visited upon America: Weekly Quill — The Economic Betrayal of the American Public
Housing Lacking Positraction
Thanks to advanced engineering and analysis of crash data, newer vehicles are built better and safer than ever. From seat belts, airbags, and backup cameras, to blind spot warnings, driver assistance and electronic stability control (ESC), each advanced technology sequentially emerged to give vehicle occupants ever-increasing protection. Traction control systems fall under ESC. Their purpose is straightforward: When the rubber doesn’t grip the road, steering control and driving stability are compromised. Since 2012, it’s been a requirement for many new cars to have the feature. But predecessors date back decades. High-torque, high-power rear-wheel-drive cars included a ‘limited slip differential,’ a system that transferred power to the wheels that weren’t slipping. General Motors’ trademark, Positraction, is more recognized for its silver screen reference than discussions around the dinner table. But it wasn’t until 1971, nearly a decade after the production of the 1963 Pontiac Tempest Marisa Tomei testified about in My Cousin Vinny that Buick introduced MaxTrac, which used an early computer system to detect rear wheel spin and modulate engine power to those wheels to provide the most traction.
Traction for monetary policy operates differently. When the Federal Reserve is in tightening mode, the aim is to cool economic activity and reduce inflation. When Powell et al are easing, the intent is to underpin interest-rate-sensitive sectors. Last week’s run of U.S. housing data updated the efficacy of the Fed’s rate cut traction.
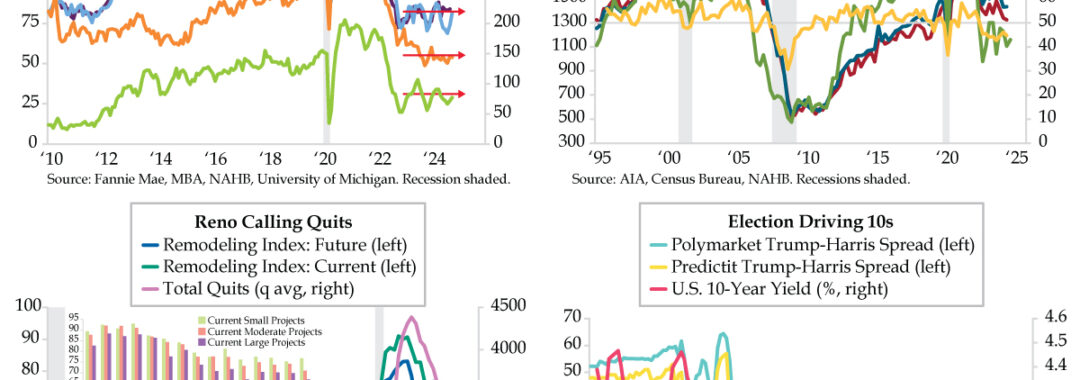
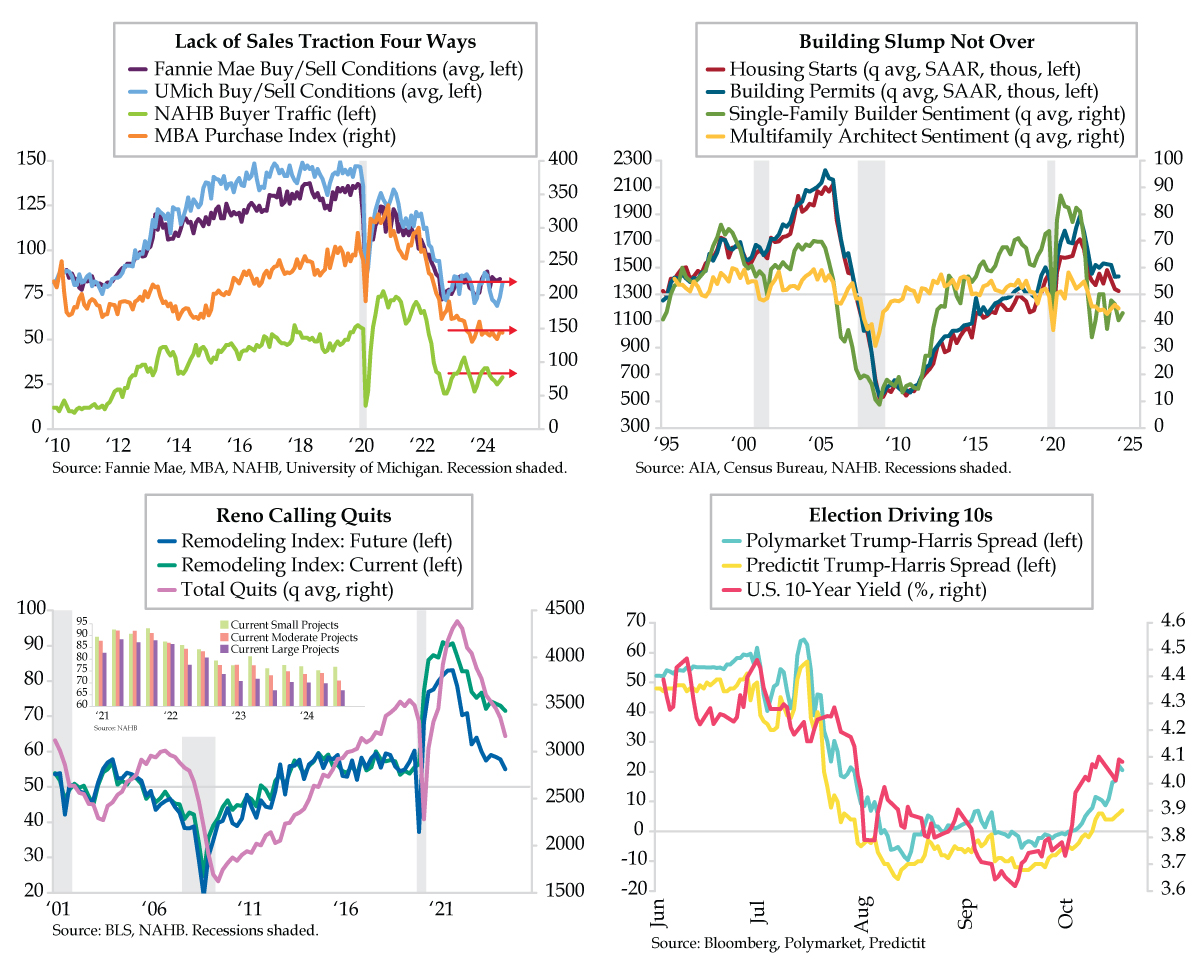
Wednesday’s latest weekly take from the Mortgage Bankers Association (MBA) report highlighted the effect of the backup in the 30-year mortgage rate to the 6.5% zone in the week ended October 11. The upshot was home purchase application volume contemporaneously falling 7.2% week-over-week, the steepest decline since February. On a smoother monthly average basis, the purchase index has been treading water all year (orange line).
The National Association of Home Builders (NAHB) Buyer Traffic index continues to show that housing affordability lacks traction. At 29 in October, the level is in line with the year-to-date average, going nowhere fast and well south of the long-run trend of 40 (lime line). NAHB proposed that “despite the beginning of the Fed’s easing cycle, many prospective buyers remain on the sideline waiting for lower interest rates,” a not-so-veiled suggestion that Powell & Co. have more wood to chop. Two survey measures from Fannie Mae and the University of Michigan concur. Averaging buying and selling conditions (because most sellers buy after they sell) generates yet another depiction resembling spinning wheels (purple and light blue lines).
How do builders see the market? Friday’s Housing Starts and Building Permits for September modestly disappointed. While the -0.5% month-over-month (MoM) was close to the consensus -0.4%, August was revised lower, to a still robust 7.8% from 9.6%. Meanwhile, permits declined -2.9% MoM, appreciably off the expected -0.7%, while the previous month was reduced mildly, to 4.6% from 4.9%. Monthly noise aside, smoother quarterly profiles showed starts falling to a new cycle low (red line) and permits treading water (blue line).
Permits are the home building oracle. Their momentum has us seeing red, and lots of it. At annualized rates over the last three months, six months, twelve months, two years and three years all ended September, the results are as follows: -7.0%, -7.5%, -5.7%, -5.9% and -4.2%, respectively. Home building-related surveys agree with the permits’ impulse. NAHB’s single-family builder sentiment remained entrenched in the contraction zone (green line) and hasn’t expanded since 2022’s second quarter. The American Institute of Architects index for the multifamily residential space has also been sub-50, in persistent pessimism, for eight straight quarters (yellow line). Got rate cuts?
Storming to record highs these last few weeks, the stocks of Home Depot and Lowe’s are seemingly immune to the data. That makes the NAHB’s quarterly Remodeling Index a reality check. Through 2024’s third quarter, components tracking future and current sentiment fell to fresh cycle lows, with the former dipping to a pre-pandemic 55.0 (blue line) and the latter edging down to 71.6 (teal line).
Since the series’ 2001 inception, the patterns drawn by each look a lot like JOLTS’ nonfarm quits (lilac line). We call Quits the ‘Take This Job and Shove It’ gauge. No surprise, peak bravado hit in 2022’s first quarter, right up there with the apex of post-pandemic renovations, which break out by small (under $20,000), moderate (between $20,000 and $50,000), and large projects ($50,000 or more). The inset chart illustrates that small projects are holding their own (green bars), while moderate and large ones have weakened (orange and purple bars). In the third quarter, future remodeling has seen both Inquires and Backlogs sink to cycle lows (not illustrated).
It goes without saying that lower mortgage rates would buttress residential investment. For now, the U.S. 10-year Treasury yield is distracted by the Presidential election. Slippage is the bond’s price is manifest in the spreads between Polymarket (turquoise line) and Predicit (yellow line), which are flagging a Trump win that promises to deliver a relatively higher degree of fiscal recklessness. For the next two weeks, at least, the bellwether 10-year yield tracker – the copper/gold ratio — pointing to lower, not higher, rates will be relegated to the back seat. Also not sitting shotgun are soaring bankruptcies and layoffs, household balance sheet distress, punk loan growth, the deepening industrial recession and inventory correction, waning global trade, geopolitics, and anything else that doesn’t give traction to the narrative spinners.

Preliminary Benchmark Wipes Out More Than a Million Private Sector Jobs
QUICK QUILL — The preliminary benchmark payroll revision was five times larger than normal and six times that for the private sector. More than a million private sector jobs have been wiped off that which was originally reported. Rates markets bull steepened and added additional probability that the Fed could undertake 100 basis points of rates reductions by year-end. Recent declines in mortgage rates, however, haven’t spurred home-buying activity reflecting the anemia in the job market.
TAKEAWAYS
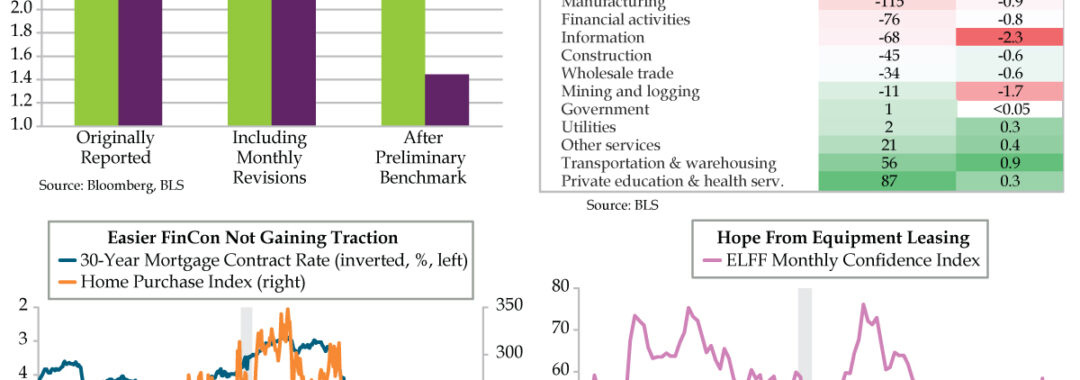
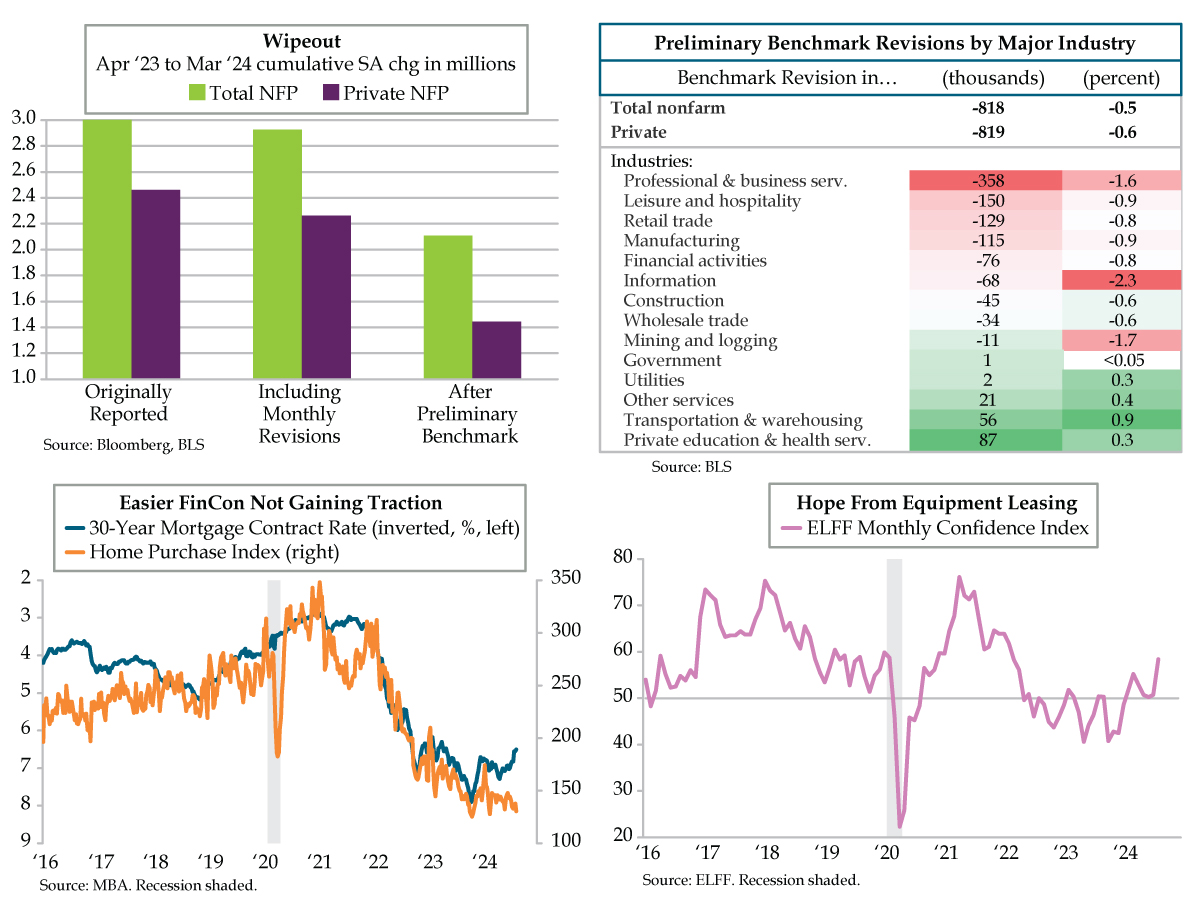
- The preliminary benchmark revision of -818,000 was -0.5% of total nonfarm employment, five times worse than normal; on the private side the decline was six times worse, taking the original 2.461 million jobs added in the 12 months ended March down to just 1.444 million
- Professional and Business Services accounted for 358,000 or 44% of private sector losses, followed by Leisure/Hospitality’s 18%, Retail Trade’s 16%, and Manufacturing’s 14%; Information, a key GDP proxy, had the largest percentage rewrite of any sector at -2.3%
- Though 30-year mortgage rates have fallen in 12 of the last 16 weeks, per the MBA, the Purchase Index has fallen by -7.8% from its late-April high; the continued weakness in housing is indicative of the labor market picture laid bare by yesterday’s payroll revisions
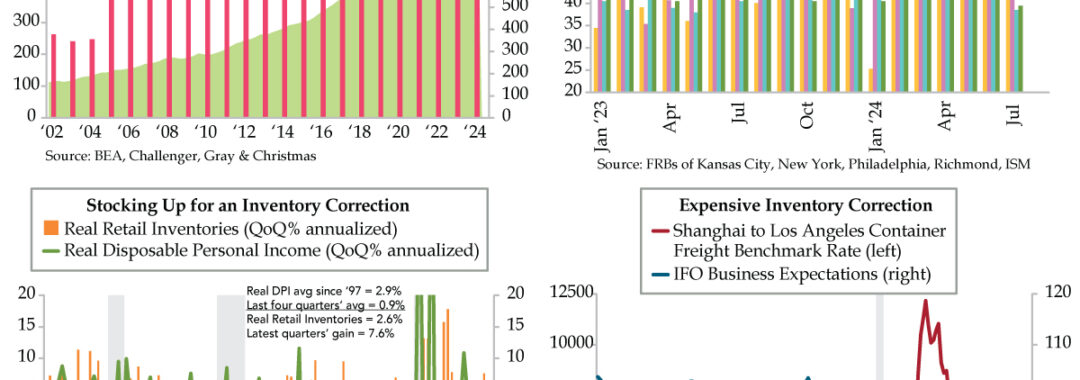

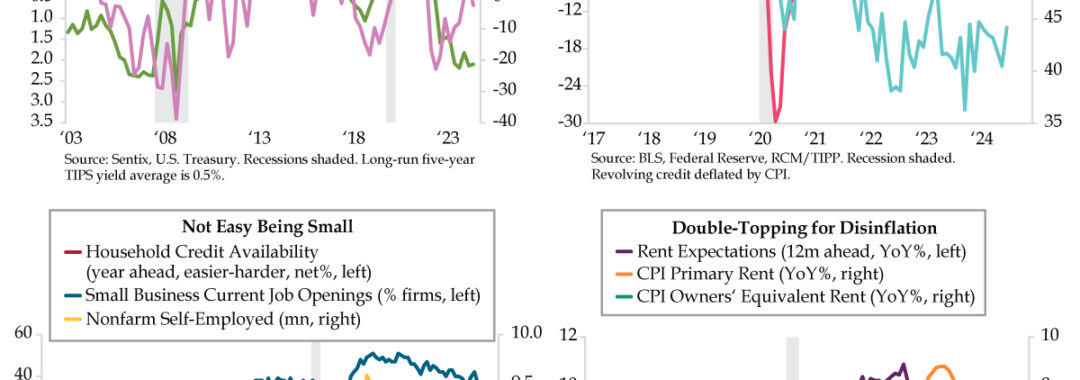
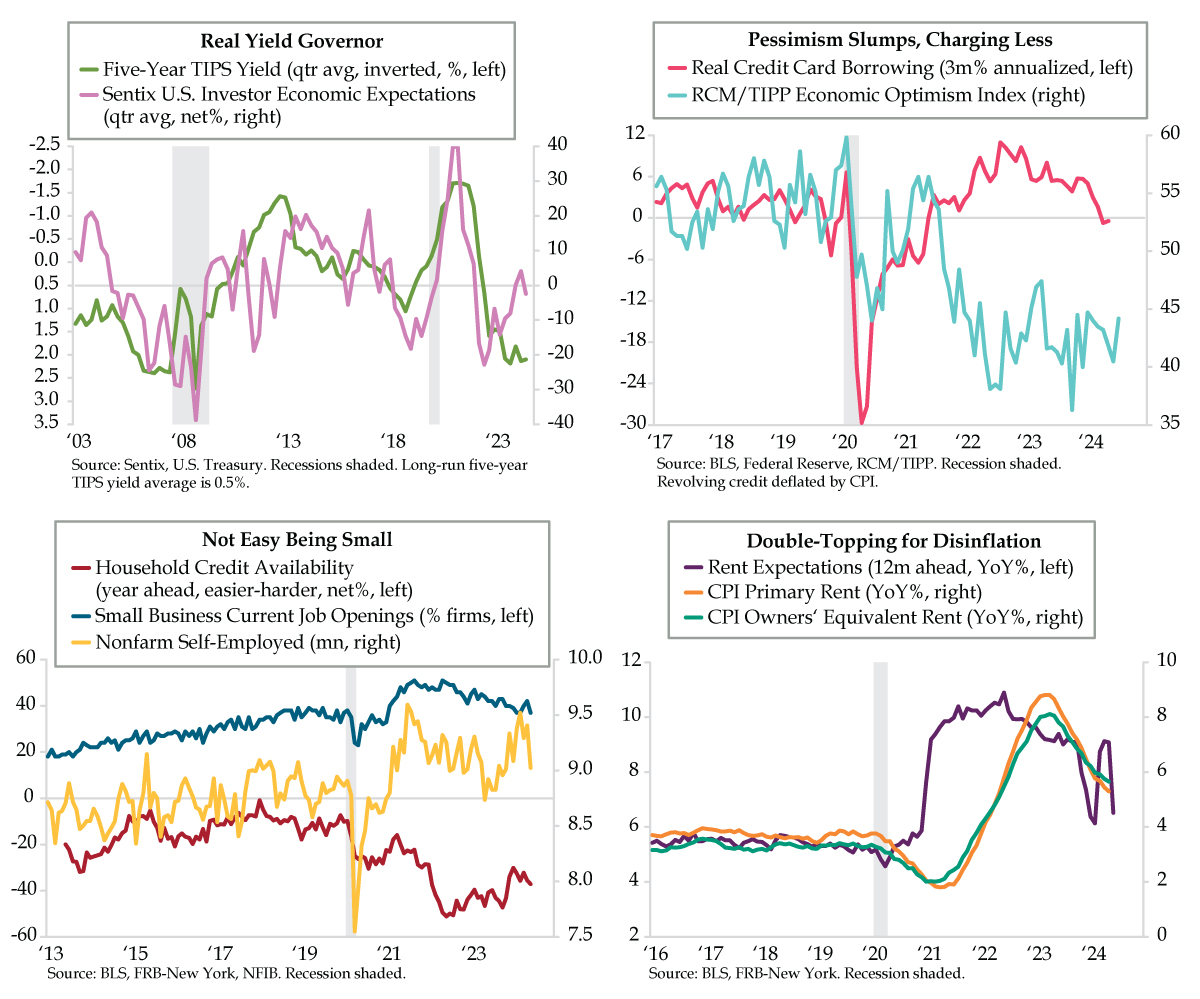
Growth, Labor, and Disinflation Risks Swell
QUICK QUILL — Above-trend real yields take a bite out of investors’ growth optimism. Consumer pessimism has manifested as a short-run contraction in credit card borrowing volume, adding to downside risks. Impaired household credit availability will act as a governor on small business job creation; nonfarm self-employed have already lost a half million in the second quarter. High conviction for rent disinflation is growing as households become aware of concessions required to move new product amidst an onslaught of fresh supply. All told, these growth, labor and inflation risks fundamentally suggest cheap vol presents a tactical opportunity.
TAKEAWAYS
- The Sentix U.S. Investor Economic Expectations Index fell to -2.5 in June, with institutional investor sentiment plummeting to -7.0 vs. retail’s still-positive 2.0; Higher for Longer has left 5-year TIPS yields north of 2% since Q3 2023, well above of their long-run 0.5% average
- Real revolving credit fell -0.4% on a 3MA basis in May, the first negative print, excluding COVID, since Q4 2019, when the economy was sliding into recession; continued weakness in the RCM/TIPP Optimism Index also flags further downside risk for consumer spending
- In the NY Fed’s Survey of Consumer Expectations, Household Credit Availability fell to a net -37.2 in June, down from January’s local high of -30.2; this aligns with NFIB current job openings falling to 37 alongside a loss of half a million nonfarm self-employed workers in Q2