

Welcome to Major League Eating
Major League Eating (MLE) is the world body that oversees all professional eating contests. Even the casual observer is familiar with the MLE-sanctioned Nathan’s Famous…
The “Fixer”
“He/She will not do or commit anything tending to degrade him/her in society or bring him/her into public hatred, contempt, scorn or ridicule, or tending…
Don’t Mess with Rocky
Adrian: There's one thing I want you to do for me. Rocky: What? Adrian: Come here. Rocky: What? Adrian: Win, win... Mickey: What're we waiting…

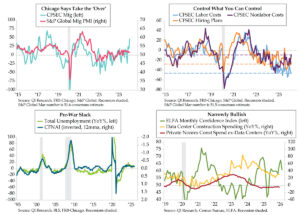
Pareidolia Spells No Fed Relief
If you think you’re seeing things, then you’re not alone. Pareidolia is the tendency for the human brain to see meaningful patterns or images in…
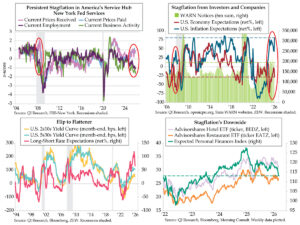
Stagflation: Worst of Both Worlds
“We now have the worst of both worlds – not just inflation on the one side or stagnation on the other, but both of them…

Shockers
U.S. colleges have the weirdest nicknames, like the UC Santa Cruz Banana Slugs, Delta State Fighting Okra and Presbyterian College Blue Hose, to name a…
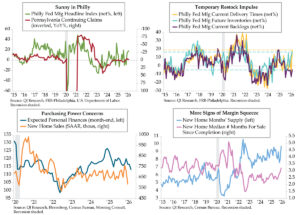
Light at the End of the Tunnel
“LIGHT AT THE END OF THE TUNNEL!” On April 6, 2020, President Trump tweeted this turn of phrase, expressing optimism that the COVID pandemic would…
Pulling the Switch
Most major blackouts are the result of cascading failures, storms or even equipment meltdowns, but there have been instances where human error caused a massive…
Cadillac Man
Larry: Tell them to stay back or I’ll blow this place and half the ****** block to hell. Joey: Stay back or he’s gonna blow…
Chomping at the Bit
“Chomping at the bit” originates from the high-tension-induced air at the starting gate of a horse race -- an equine so eager to run that…
Keep Calm and Carry On
“Keep Calm and Carry On” is an archetype lost and found story. Originally designed by the British Ministry of Information in the Summer 1939, it…
An Unsolved Italian Murder
“I may be an unbeliever, but I am an unbeliever who has a nostalgia for a belief.” Pier Paolo Pasolini In 1975, Italian film…
1
2
3
4
5
6
7
8
9
10
11
12
13
14
15
16
17
18
19
20
21
22
23
24
25
26
27
28
29
30
31
32
33
34
35
36
37
38
39
40
41
42
43
44
45
46
47
48
49
50
51
52
53
54
55
56
57
58
59
60
61
62
63
64
65
66
67
68
69
70
71
72
73
74
75
76
77
78
79
80
81
82
83
84
85
86
87
88
89
90
91
92
93
94
95
96
97
98
99
100
101
102
103
104
105
106
107
108
109
110
111
112
113
114
115
116
117
118
119
120
121
122
123
124
125
126
127
128
129
130
131
132
133
134
135
136
137
138
139
140
141
142
143
144
145
146
147
148
149
150
151
152
153
154
155
156
157
158
159
160
161
162
163
164
165